More about Fifth Third Bancorp
Regulatory Filings for Fifth Third Bancorp
Fundamentals for Fifth Third Bancorp

The Biggest IPO Year Ever: Can Markets Absorb It?
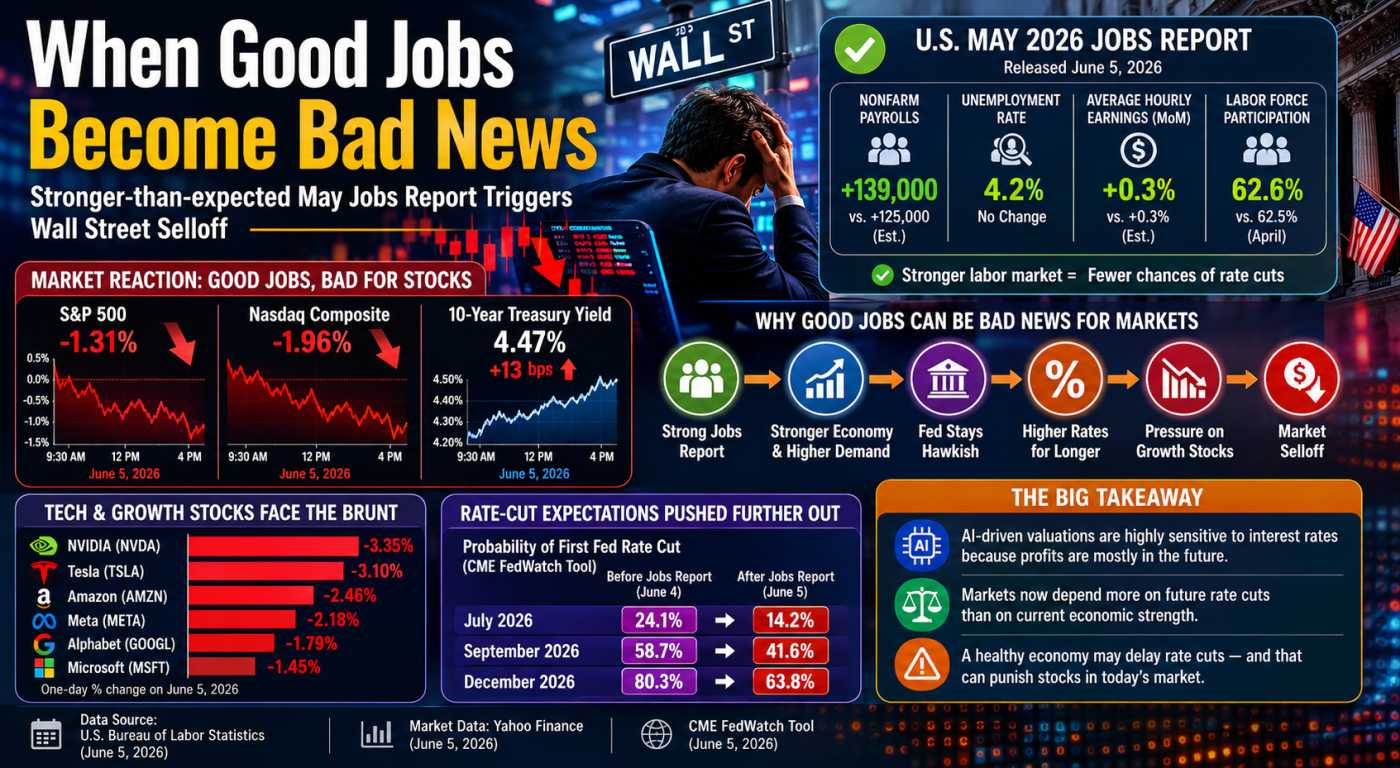
The Jobs Report That Crashed the Rally

The Fed Study Revealing Tomorrow's Investment Themes
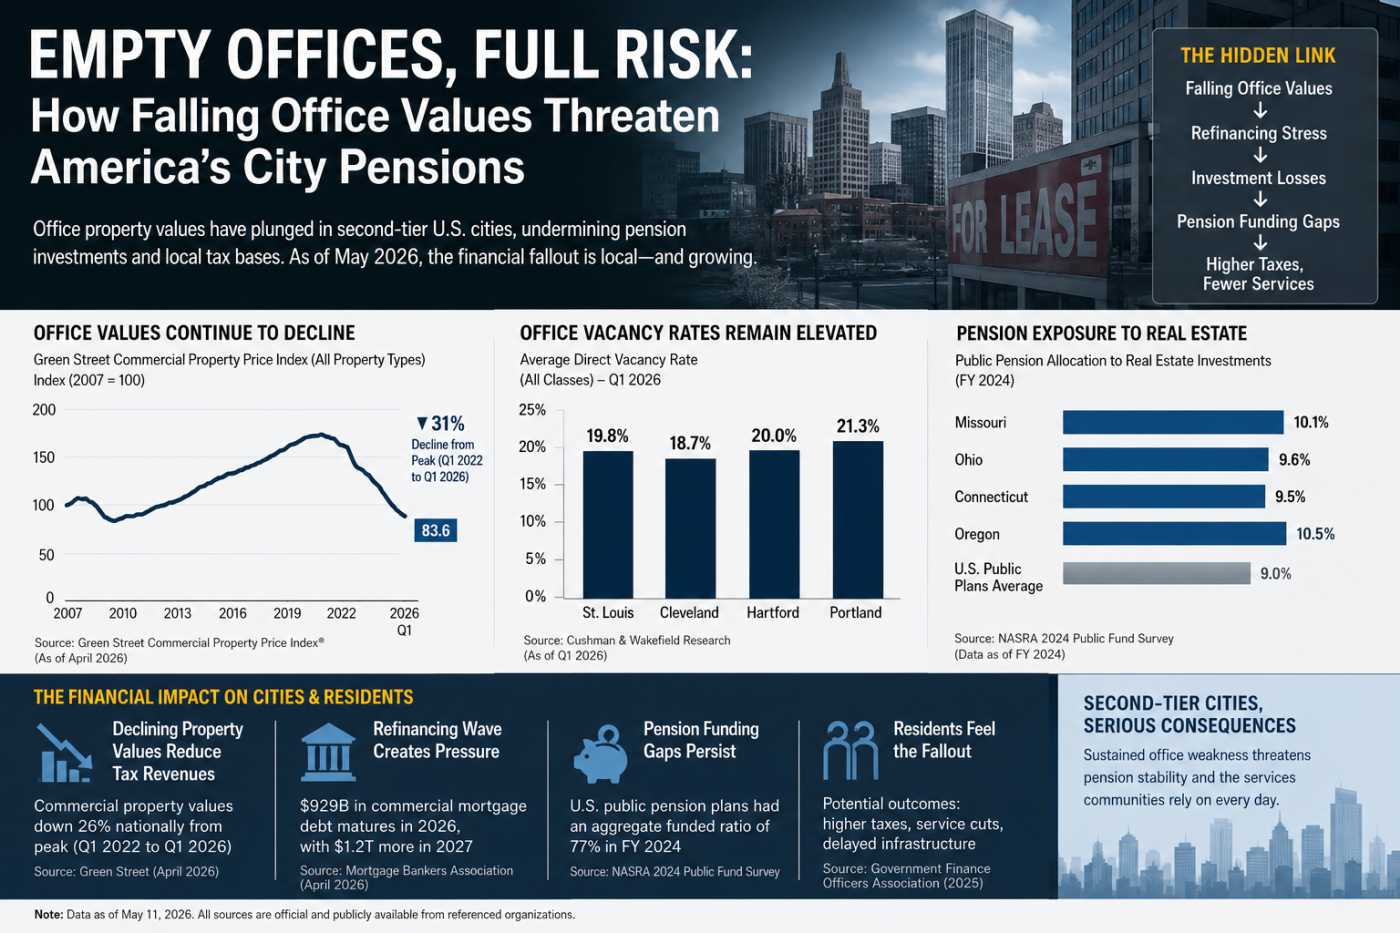
America’s Empty Offices Hit Pensions Hard
Technicals for Fifth Third Bancorp


Price Summary
On 2026-06-10, Fifth Third Bancorp's stock opened at 52.91, reached a high of 53.93, dropped to a low of 52.44, and closed down -0.49% at 52.65, with a trading volume of 8254271 shares.Throughout the 52-week period, the stock hit a high of 55.08 and a low of 37.98.
Technicals
Support and Resistance: The current price of 52.65 for FITB finds support at 50.89 and resistance at 52.86. These levels define a range in which the price might oscillate, with 50.89 as a potential support and 52.86 as a resistance level.
Aroon: Aroon's bullish trend continues, with Aroon Up remaining at the 100 level. This indicates sustained bullish momentum, but to fully understand the trend's implications, it should be analyzed alongside other indicators. A more comprehensive assessment will provide a clearer picture of the direction.

Bol. Bands: The BOLL BANDS is neutral, showing no definitive signals of a trend either upward or downward. This neutral stance indicates a period of market indecision, where the direction is unclear.

Parabolic SAR: The PSAR continues to signal a bullish outlook, establishing a key support level that reinforces the market's upward momentum. This support could serve as a base for continued gains, suggesting that the bullish trend is likely to persist.

Stochastic: The stochastic indicator shows the K-line below the D-line and above 80, hinting at the potential beginning of a bearish price move for FITB. This setup could signal that the market's recent strength is weakening, possibly leading to a downturn. Traders should watch for further evidence of a bearish trend.

Tripple Moving Agerage: The alignment of the 20, 50, and 100 moving averages suggests a bearish trend, but the wavering slopes of the 20 and 50 SMAs hint at a potential shift. This weakening momentum could indicate that the bearish trend for FITB is losing steam, possibly leading to a bullish reversal in the near future. Investors should watch for signs of a market turnaround as the current downtrend shows signs of faltering.

A company's technical data, including stock price and trading volume, can provide valuable insights when considered alongside its fundamentals. These include financial performance, market share, and growth strategy, as well as broader industry dynamics. Examining these factors helps investors or analysts make more informed decisions, as the company's fundamentals offer context for understanding how and why certain technical patterns may emerge in the market.
If you have enjoyed reading, spread the word:
Good prospects:
Companies with the best and the worst technicals.
Latest Regulatory Filings for SP5
Companies with the best and the worst fundamentals.

Rural Hospitals Buckle Under Private Equity
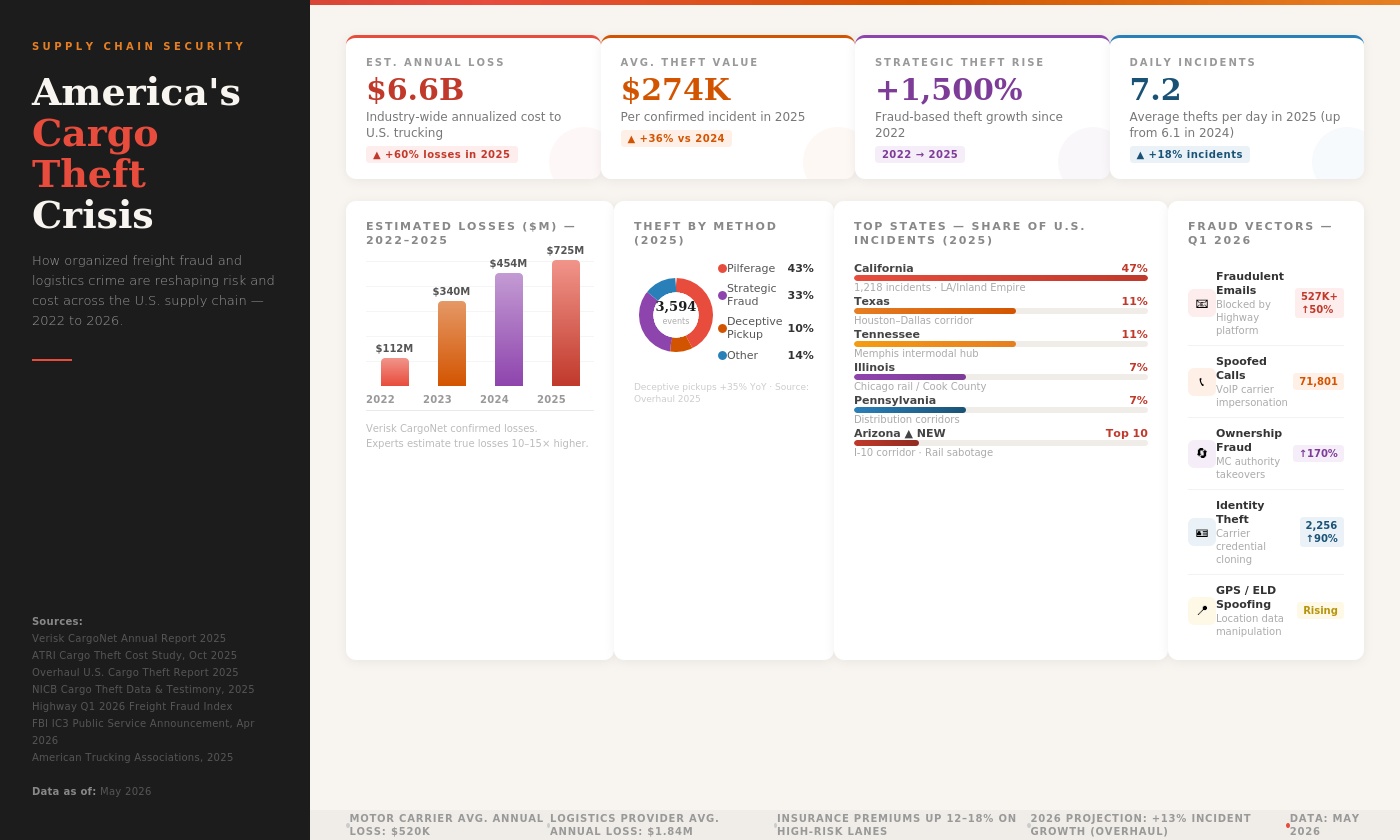
Fake Brokers, Spoofed GPS: Who Pays for Cargo Crime?

Crypto’s $2.4T Reality Check in 2026
