
More about Philip Morris International Inc.
Regulatory Filings for Philip Morris International Inc.
Fundamentals for Philip Morris International Inc.

Diversification Shielded U.S. Banks

Repo, Debt and Risk: The Fed's Untold Warning for 2026

When Losing Money Pays: America's Broken Market Logic

The Hidden Time Bomb in AI Finance
Technicals for Philip Morris International Inc.



Price Summary
On 2026-07-22, PM's stock started at 192.03, reached a high of 199.78, fell to 189.38, and ended 1.18% higher at 194.3, with 7794393 shares traded.The top price for the stock in the last 52 weeks is 194.3, with the bottom price being 144.33.
Technicals
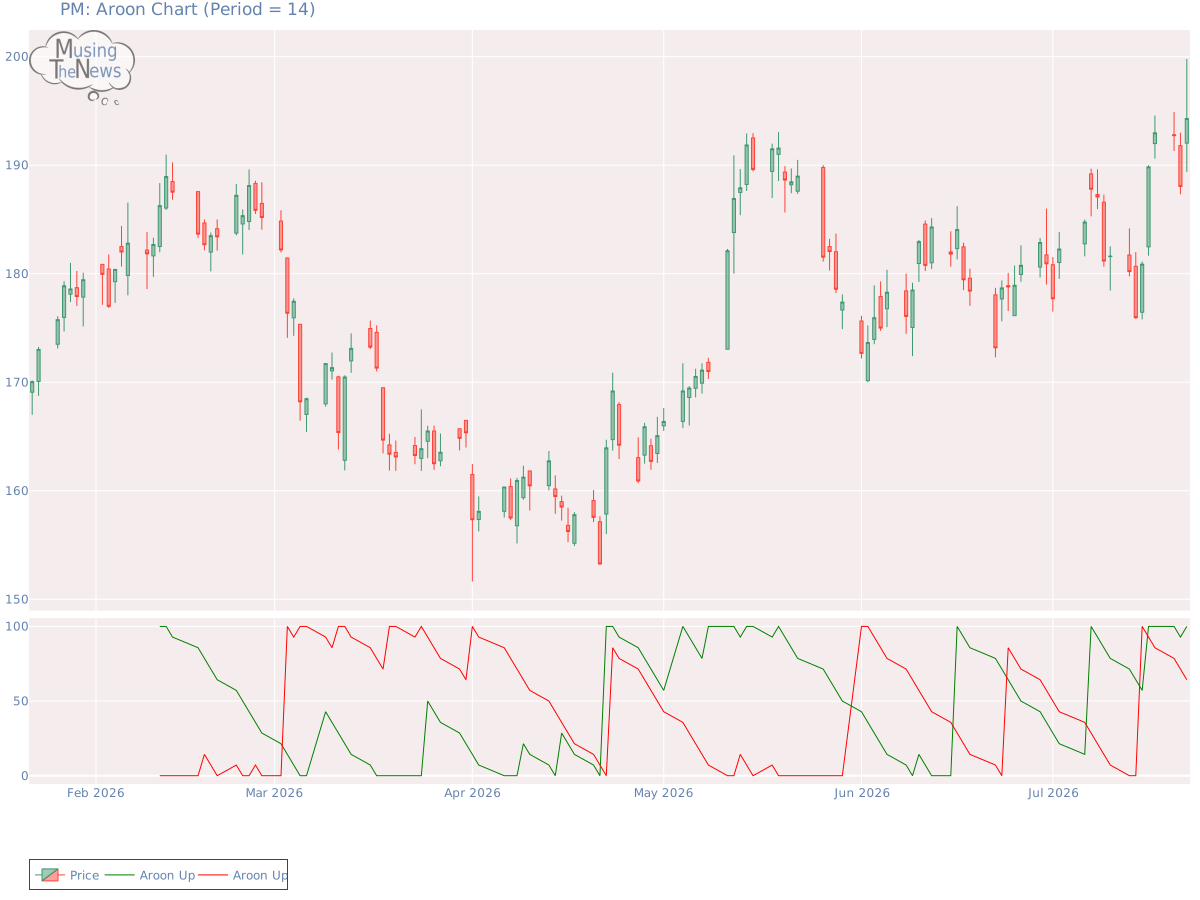
Aroon: The Aroon indicator shows a continued bullish trend, with Aroon Up staying at the 100 level. This sustained strength suggests a strong upward momentum. However, further analysis is required, especially when combined with other indicators, to confirm the trend's durability and potential future direction.
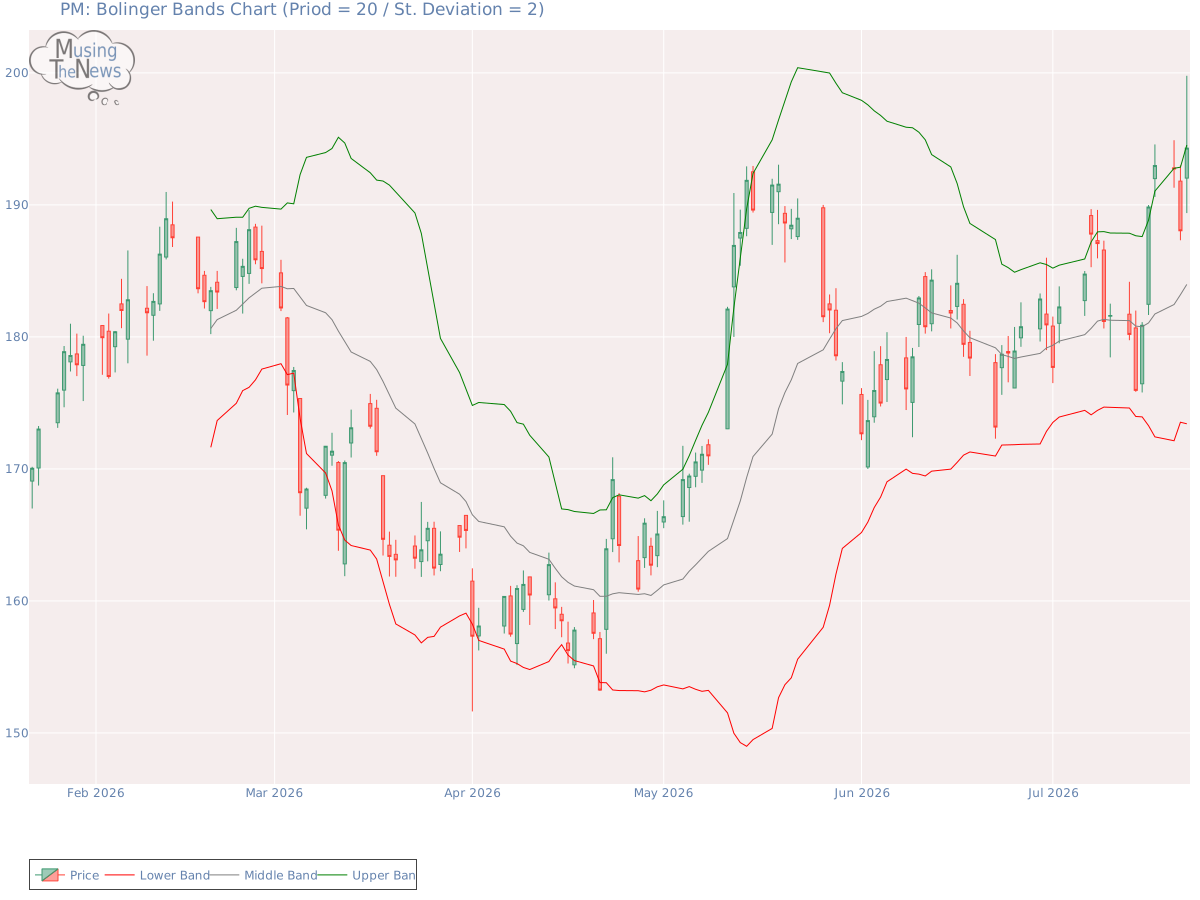
Bol. Bands: The BOLL BANDS is neutral, showing no definitive signals of a trend either upward or downward. This neutral stance indicates a period of market indecision, where the direction is unclear.
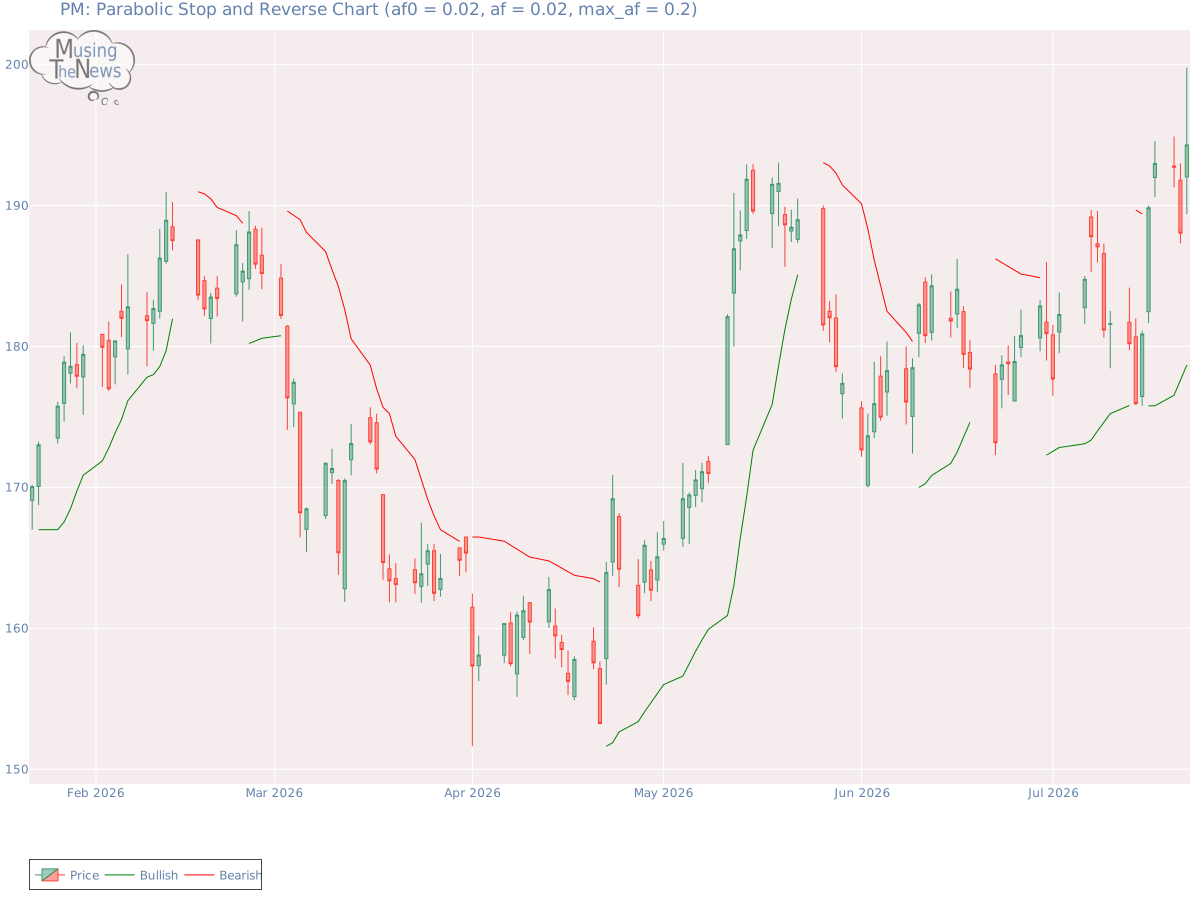
Parabolic SAR: The PSAR remains bullish, setting a critical support level that may help sustain the market's upward trend. This persistent bullish outlook suggests that the market is likely to continue climbing, with the support level offering a foundation for further growth.
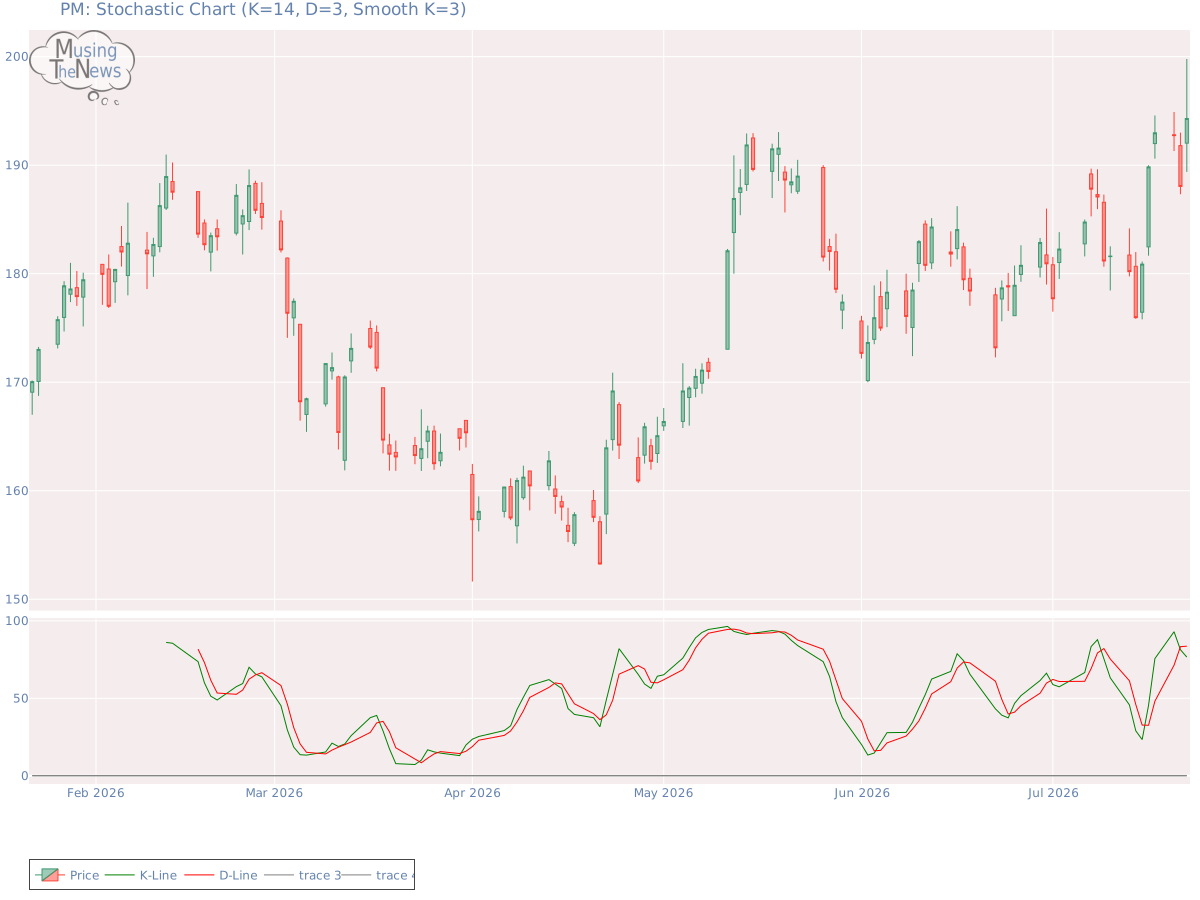
Stochastic: The STOCHASTIC is showing a neutral stance, with no definitive indication of an upward or downward trend for PM. This neutral position suggests a period of indecision in the market, making it difficult to predict the next move.
Tripple Moving Agerage: The 20, 50, and 100 moving averages are aligned in a bearish formation, suggesting a downtrend. However, the slopes of the 20 and 50 SMAs are beginning to waver, indicating that the bearish momentum may be losing strength. This weakening could signal a potential shift towards bullish price action, as the market's current downward trajectory shows signs of faltering and a possible reversal may be near for PM.
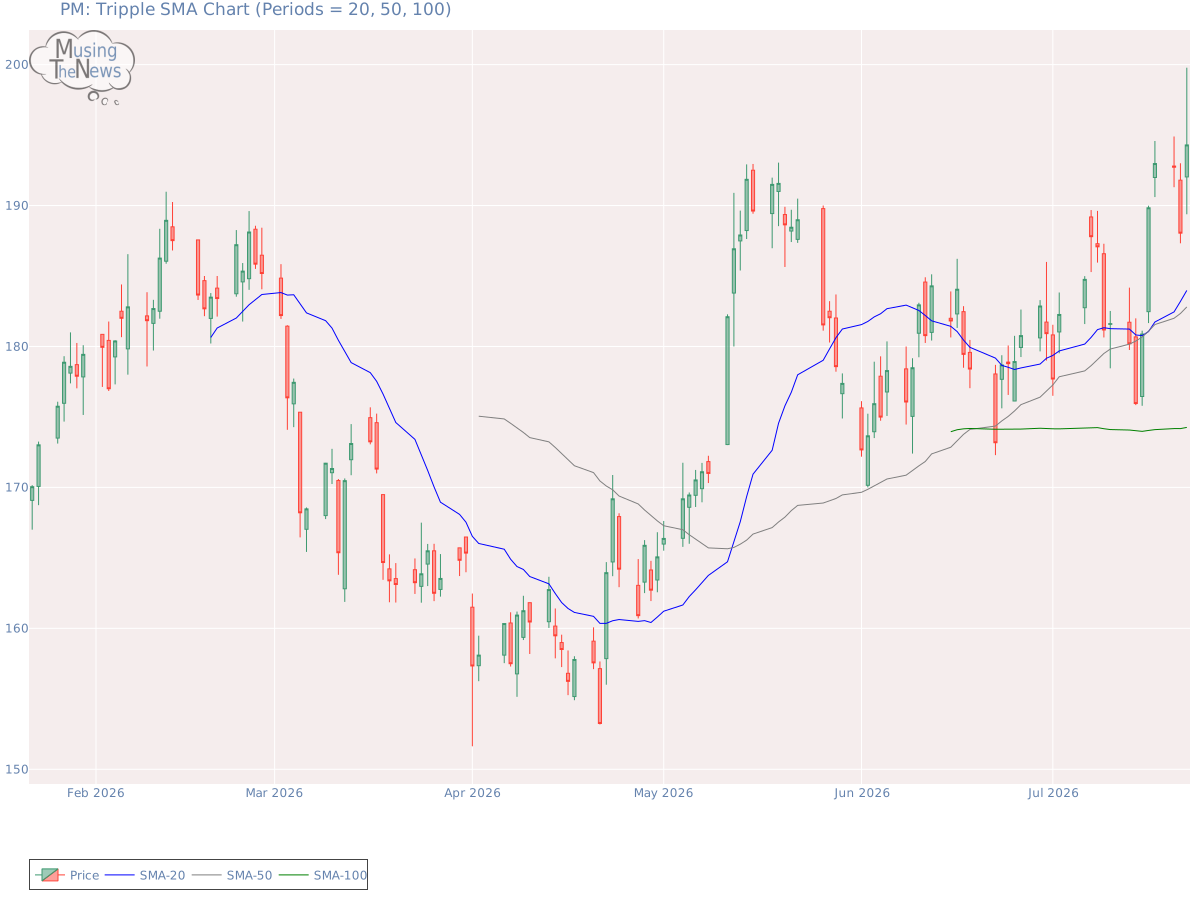
The technical analysis of a company's stock performance is valuable, but only when considered in conjunction with the company's fundamentals. These fundamentals, including financial strength, earnings growth, and leadership, provide a foundation for understanding market movements. Additionally, industry trends and competitive pressures play an important role. By integrating both fundamental and technical analysis, one can better evaluate the company's true potential and make more informed investment decisions.
If you have enjoyed reading, spread the word:
Good prospects:
Companies with the best and the worst technicals.
Latest Regulatory Filings for SP5
Companies with the best and the worst fundamentals.
Why Electricians Now Out-Earn Software Engineers

The Apartment Glut Changing America’s Rental Market

Why Community Colleges Are Winning Again