
More about Parker-Hannifin Corporation
Regulatory Filings for Parker-Hannifin Corporation
Fundamentals for Parker-Hannifin Corporation

AI Learns to Read the Federal Reserve

AI Subscriptions Rewrite the Inflation Playbook

Diversification Shielded U.S. Banks

Repo, Debt and Risk: The Fed's Untold Warning for 2026
Technicals for Parker-Hannifin Corporation



Price Summary
On 2026-08-20, PH's stock began at 1017.11, peaked at 1023.68, dipped to 999.82, and closed up -1.67% at 1000.13, with a volume of 559700 shares.The peak price for the stock in the past 52 weeks is 1073.87, with the lowest price being 0.0.
Technicals
Support and Resistance: At 1000.13, the price is held up by support at 985.0 and faces resistance at 1011.8 for PH. This suggests a trading range where 985.0 provides a base and 1011.8 limits upward movement.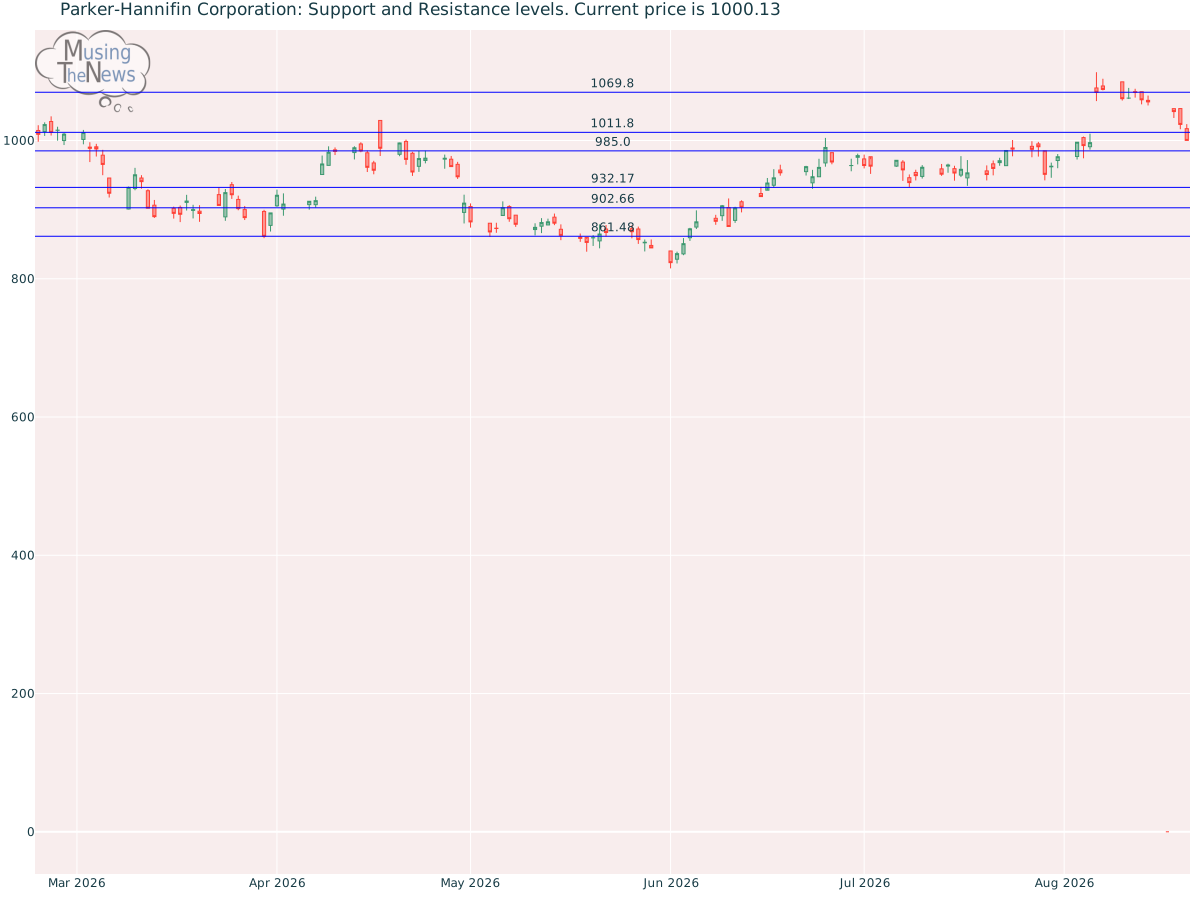
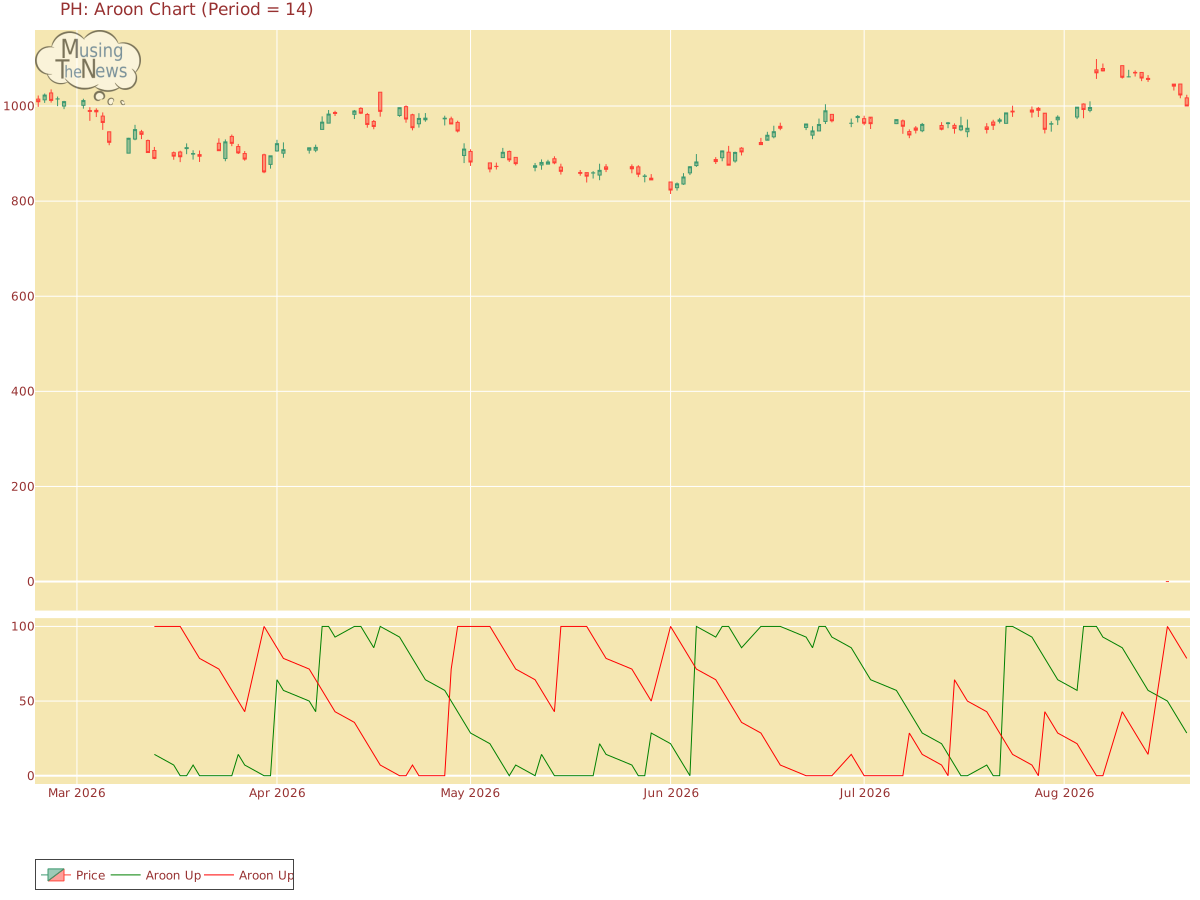
Aroon: The current state of the AROON is neutral, providing no clear signals for either an upward or downward movement. This indicates that the market may be in a state of equilibrium, with no strong momentum in either direction.
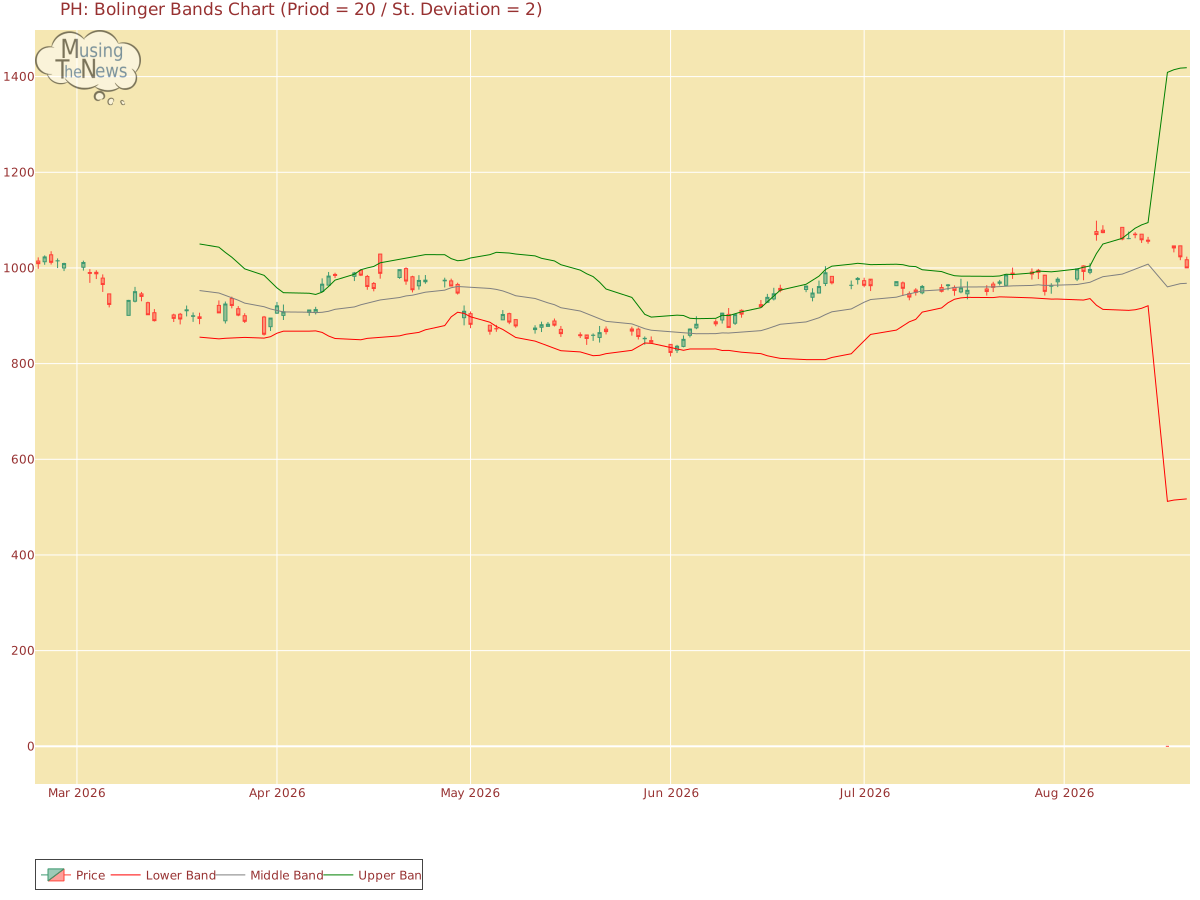
Bol. Bands: The BOLL BANDS is currently neutral, showing no clear bias toward an upward or downward trend. This suggests that the market may be in a phase of indecision or consolidation.
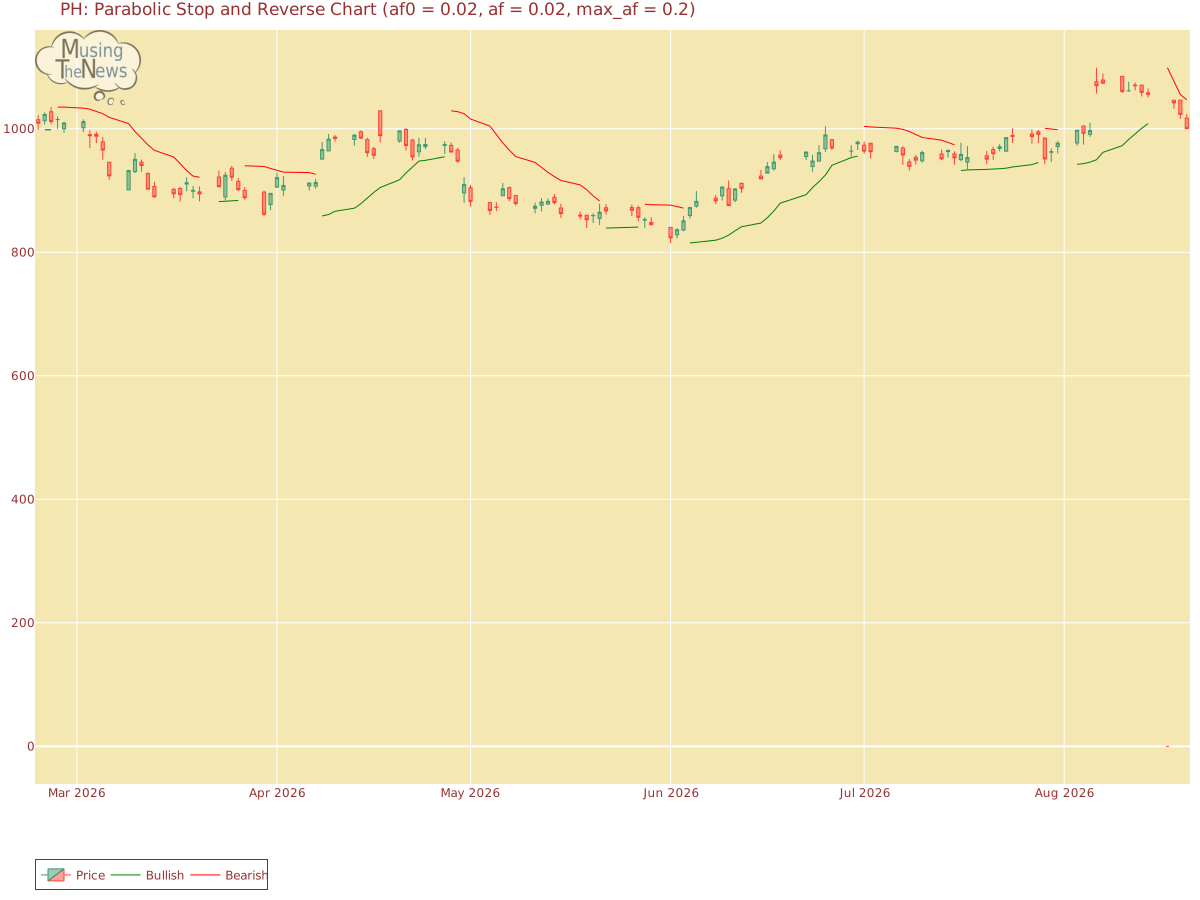
Parabolic SAR: The PSAR remains bearish, reinforcing a resistance level that could restrict any upward movement. This resistance indicates that the market may remain under bearish control, with limited potential for gains.
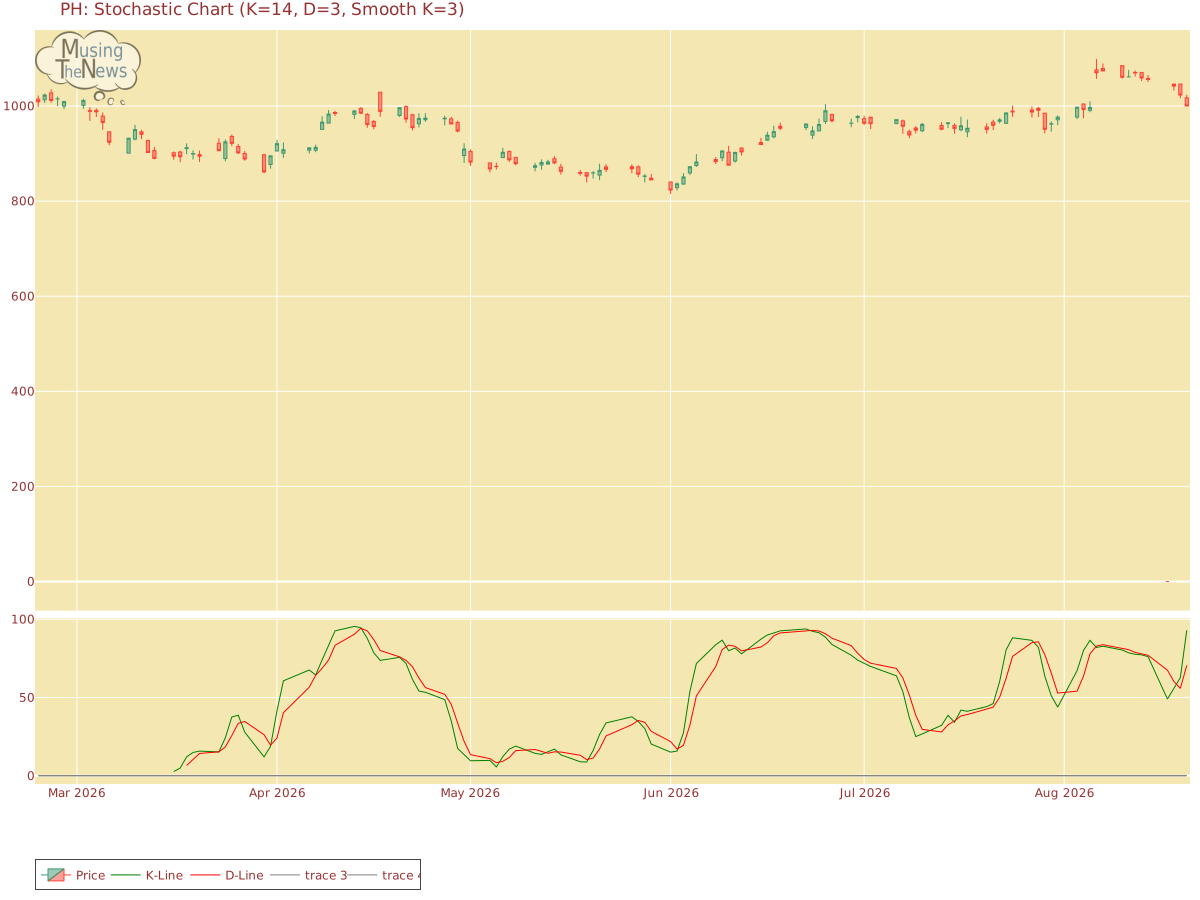
Stochastic: PH's stochastic indicator reflects a bullish trend, with the K-line positioned above the D-line and surpassing the 80 threshold. This setup suggests strong upward momentum, indicating that the market may continue to rise. Investors could interpret this as a positive signal for further gains.
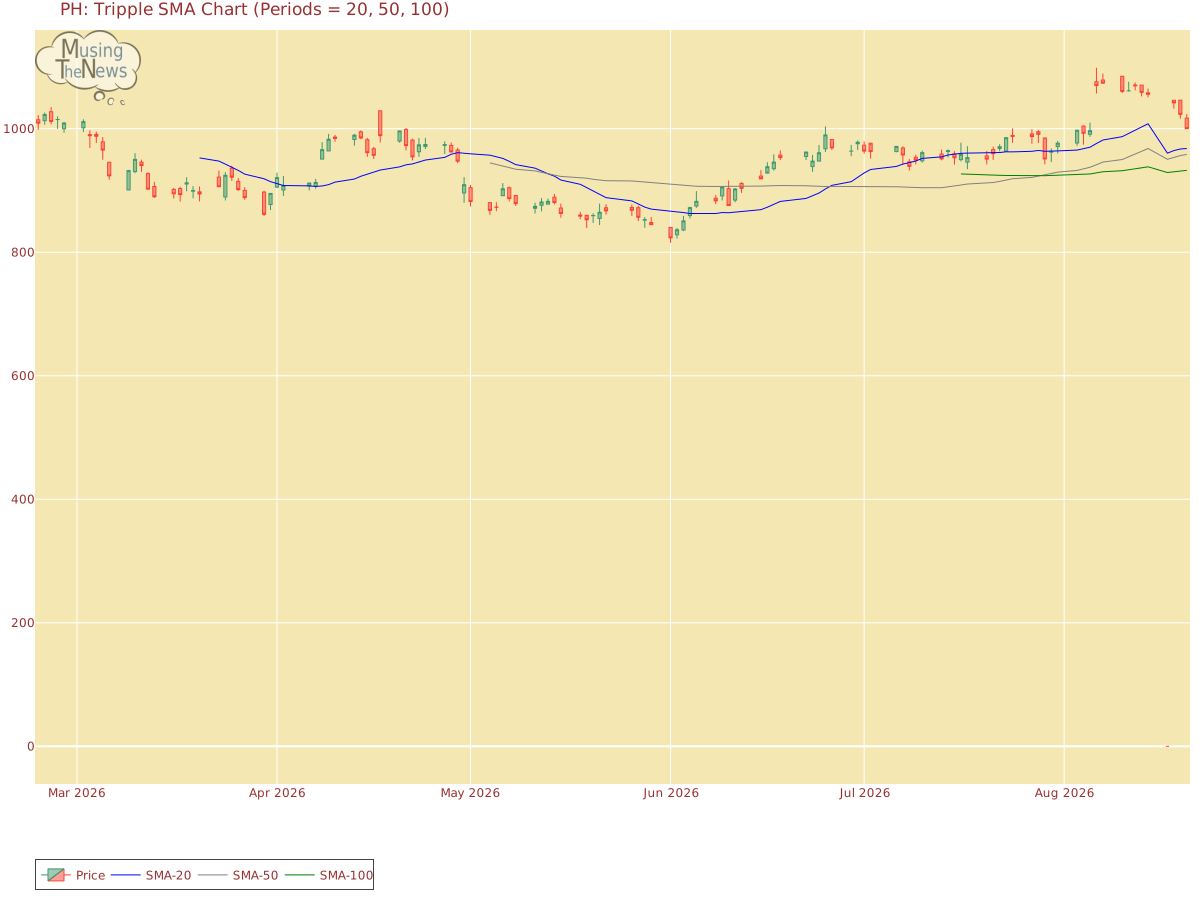
Tripple Moving Agerage: The Tripple MOVING AVG is currently neutral, showing no clear bias toward an upward or downward trend. This suggests that the market may be in a phase of indecision or consolidation.
When evaluating a company, it is crucial to examine its fundamentals, including its financial statements, management structure, and market position. Additionally, understanding the broader industry trends, competition, and regulatory landscape helps to create a well-rounded view. By assessing both the company's internal factors and the external environment in which it operates, you can extract more valuable insights from its technical performance, such as stock price movements and trading patterns.
If you have enjoyed reading, spread the word:
Good prospects:
Companies with the best and the worst technicals.
Latest Regulatory Filings for SP5
Companies with the best and the worst fundamentals.

When Losing Money Pays: America's Broken Market Logic

The Hidden Time Bomb in AI Finance
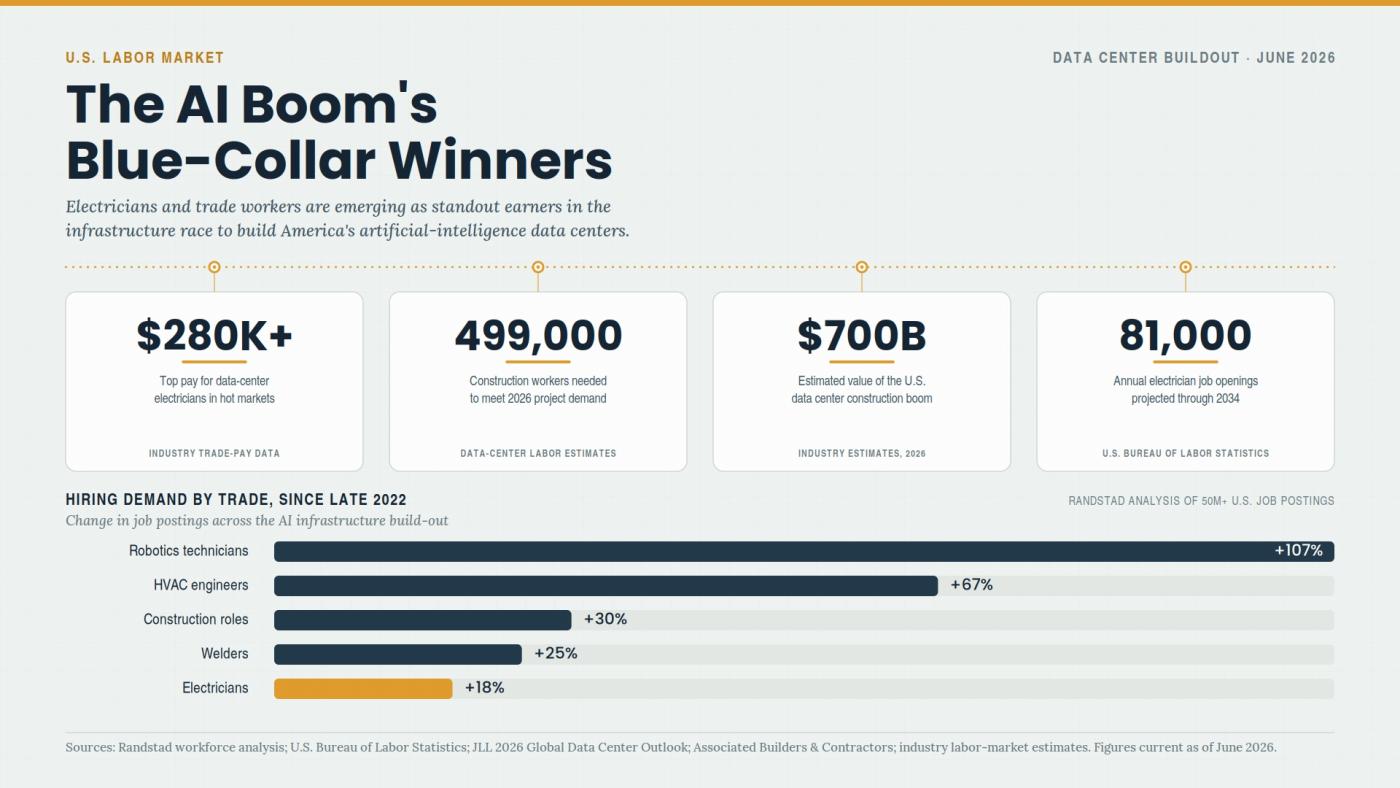
Why Electricians Now Out-Earn Software Engineers