More about The Procter & Gamble Company
Regulatory Filings for The Procter & Gamble Company
Fundamentals for The Procter & Gamble Company
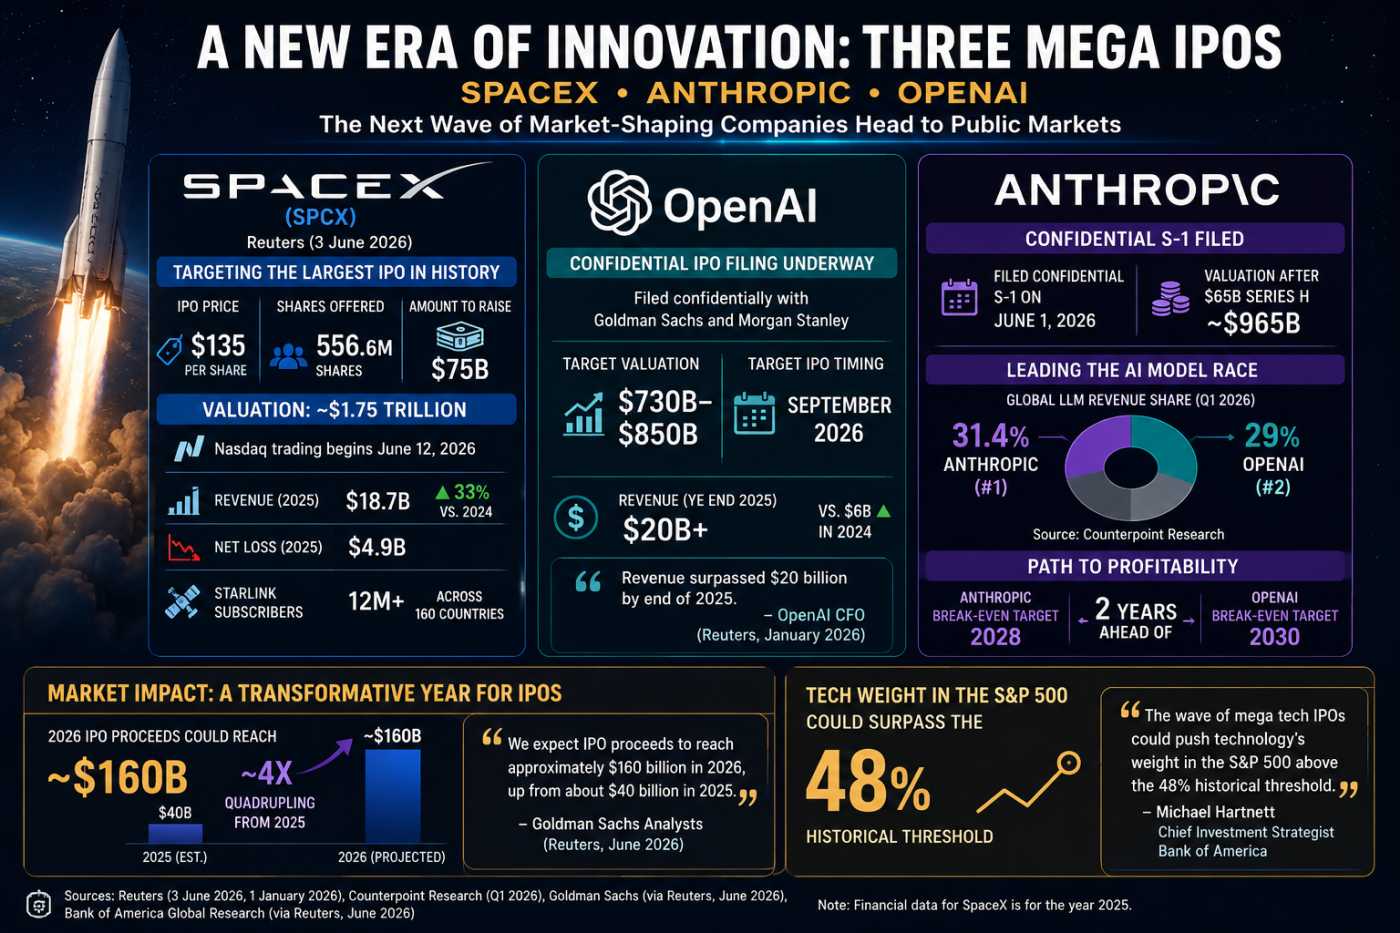
The Biggest IPO Year Ever: Can Markets Absorb It?
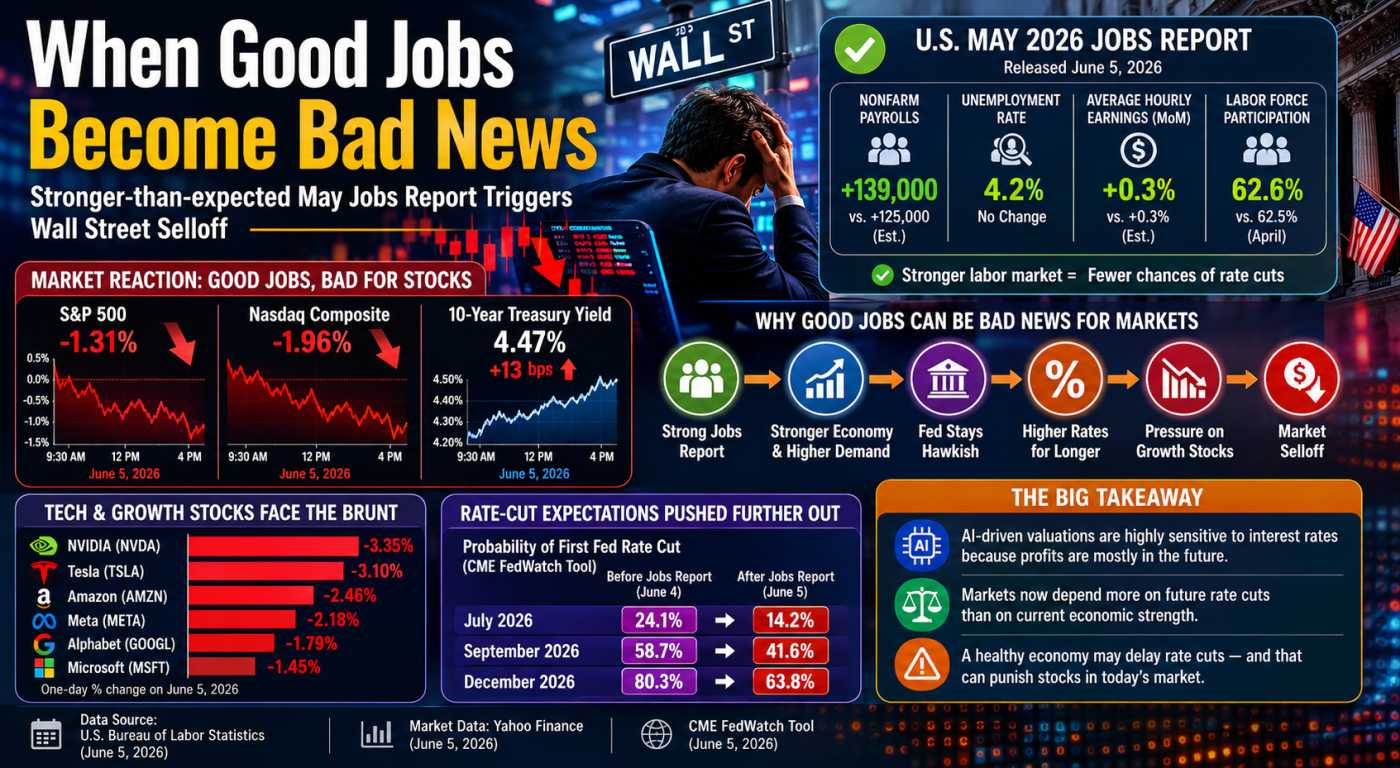
The Jobs Report That Crashed the Rally

The Fed Study Revealing Tomorrow's Investment Themes
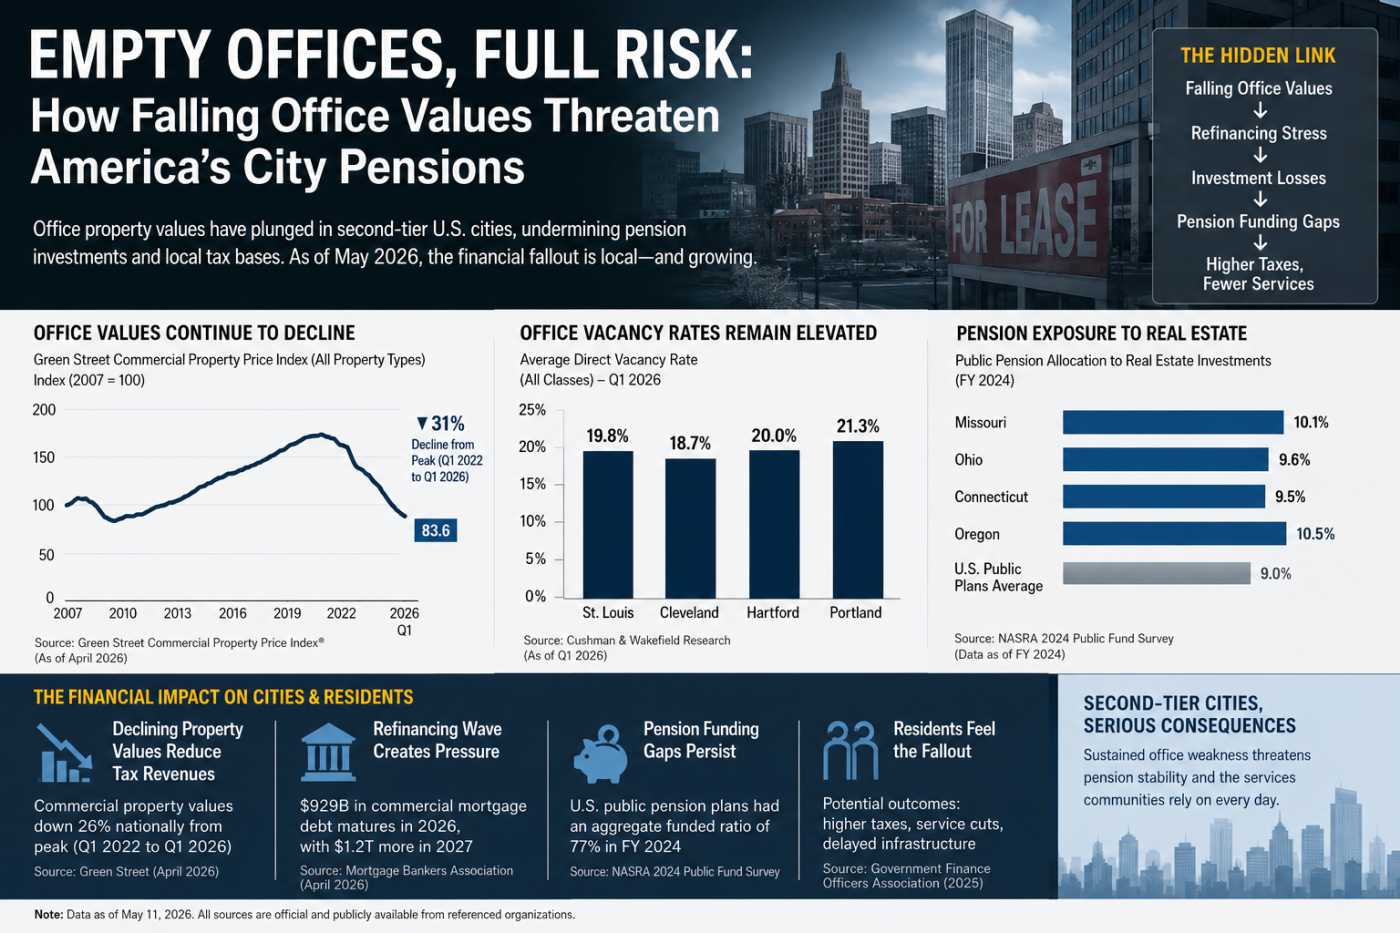
America’s Empty Offices Hit Pensions Hard
Technicals for The Procter & Gamble Company


Price Summary
The Procter & Gamble Company's stock opened at 149.91 on 2026-06-10, surged to a high of 150.43, hit a low of 148.38, and closed up -0.57% at 149.05, with 7198053 shares traded.The stock reached its highest price of 167.2 and its lowest price of 138.04 during the 52-week period.
Technicals
Support and Resistance: The price for PG at 149.05 is supported by the 147.81 level and faces resistance at 150.65. This range indicates key levels where the price may find buyers near 147.81 and sellers near 150.65, defining a trading range.
Aroon: The bullish trend in Aroon continues for PG, with Aroon Up maintaining its position at the 100 level. This suggests sustained upward momentum, but further analysis is needed, especially in combination with other indicators, to confirm the trend's future prospects.

Bol. Bands: The price is currently positioned above the upper Bollinger Band, where it has remained since its last move upward. This suggests strong bullish momentum and a possible overbought condition. Traders might interpret this as a sign of sustained strength, but the extended period above the band also suggests that a correction or pullback could be on the horizon.

Parabolic SAR: The PSAR for PG maintains a bullish outlook, establishing a crucial support level that may help maintain the current upward momentum. This strong support suggests that the market is poised to continue its upward trend, providing confidence in the ongoing bullish sentiment.

Stochastic: The stochastic indicator for PG reflects a bullish outlook, with the K-line positioned above the D-line and surpassing the 80 mark. This setup suggests strong upward momentum, implying that the market may continue to rise. Investors may interpret this as a positive signal for further gains.

Tripple Moving Agerage: A bullish trend is suggested by the alignment of the moving averages, with additional confirmation coming from the upward slope of the 20, 50, and 100-day aggregates. This setup indicates that the market is gaining momentum, which could lead to sustained growth for PG. Traders might interpret this as a favorable signal for continued gains.

Analyzing the technical indicators of a company, such as stock price and trading volume, requires first understanding its fundamentals. These fundamentals include profitability, growth potential, and market position. Furthermore, knowing the broader industry trends and competitive landscape provides critical context. When both the company's internal data and the external environment are considered, it allows for more meaningful conclusions about the company's technical performance and future trajectory.
If you have enjoyed reading, spread the word:
Good prospects:
Companies with the best and the worst technicals.
Latest Regulatory Filings for SP5
Companies with the best and the worst fundamentals.

Rural Hospitals Buckle Under Private Equity
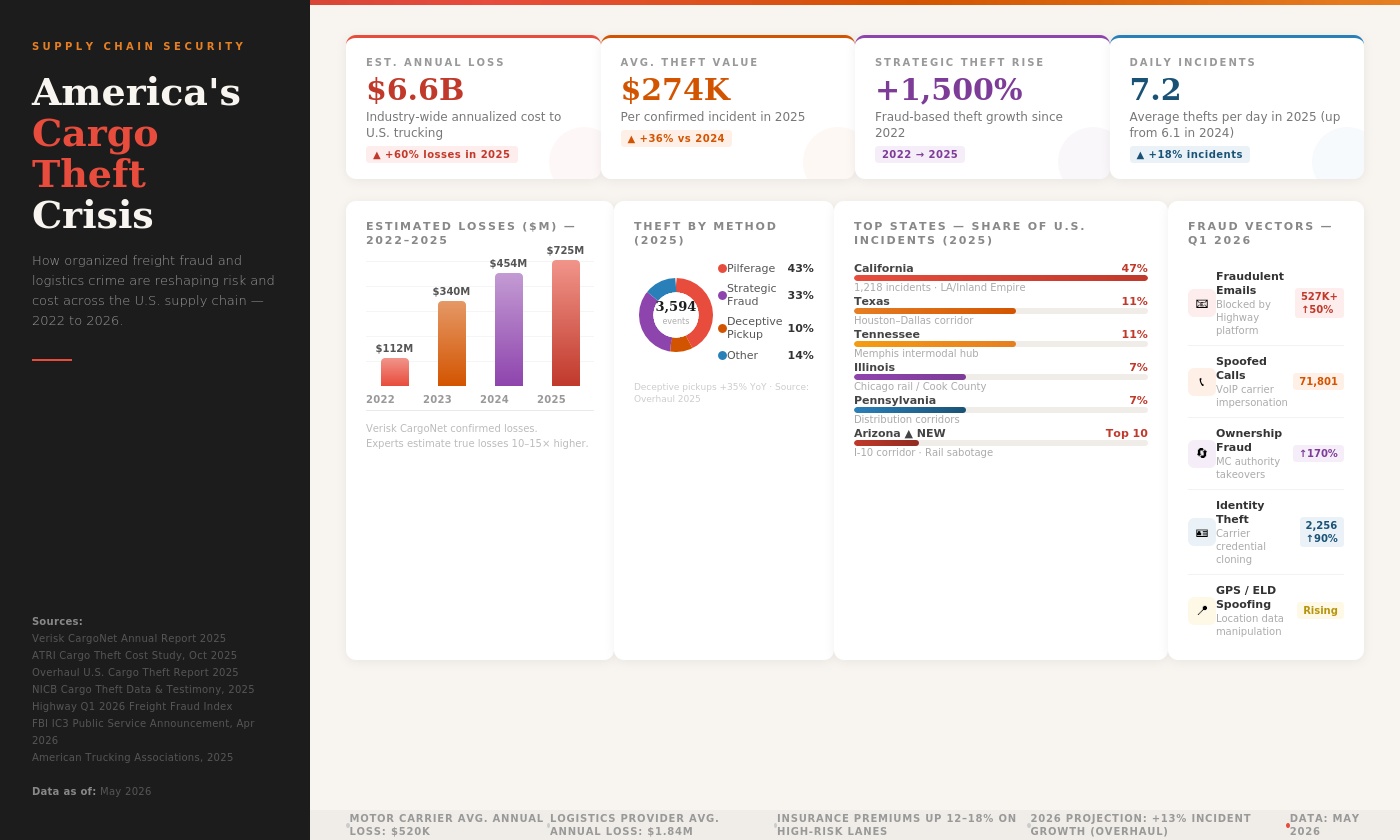
Fake Brokers, Spoofed GPS: Who Pays for Cargo Crime?
Crypto’s $2.4T Reality Check in 2026
