More about Otis Worldwide Corporation
Regulatory Filings for Otis Worldwide Corporation
Fundamentals for Otis Worldwide Corporation

Diversification Shielded U.S. Banks

Repo, Debt and Risk: The Fed's Untold Warning for 2026

When Losing Money Pays: America's Broken Market Logic

The Hidden Time Bomb in AI Finance
Technicals for Otis Worldwide Corporation


Price Summary
On 2026-07-22, Otis Worldwide Corporation's stock opened at 70.36, reached 72.25, hit a low of 69.69, and rose 0.07% to close at 70.41, with 8523414 shares traded.The peak price for the stock in the past 52 weeks is 93.62, with the lowest price being 69.34.
Technicals
Aroon: The AROON indicator is pointing to a strong bearish trend, with Aroon Down increasing and the Aroon Oscillator staying low. This suggests that the downward trend is likely to continue, signaling ongoing bearish momentum. The steady low level of the Aroon Oscillator indicates further weakness.

Bol. Bands: The price has fallen below the lower Bollinger Band and has remained there since the previous move, suggesting a strong bearish trend for OTIS. This sustained position below the band may indicate that the market is oversold, with downward pressure dominating the current trading environment. The persistent stay in this zone could signal further declines unless a reversal occurs, making it a key point for traders to watch closely.

Parabolic SAR: The PSAR for OTIS has shifted from bullish to bearish, hinting at a possible market reversal. If supported by other trends, this could be a very bearish signal. Traders should consider this development carefully and seek additional confirmation before making decisions.

Stochastic: The STOCHASTIC is neutral, showing no definitive signals of a trend either upward or downward. This neutral stance indicates a period of market indecision, where the direction is unclear.

Tripple Moving Agerage: The Tripple MOVING AVG is in a neutral stance, not pointing to a clear trend in either direction. This suggests that the market may be lacking strong momentum, making it difficult to predict the next move.

When evaluating a company's technical indicators like price trends and trading volume, it's important to also assess its fundamentals. Key factors include the company's profitability, growth rate, and financial stability. Furthermore, considering the industry within which the company operates provides additional context, as factors like competition and market demand can affect performance. By combining this analysis, you can make more informed judgments about the company's future prospects.
If you have enjoyed reading, spread the word:
Good prospects:
Companies with the best and the worst technicals.
Latest Regulatory Filings for SP5
Companies with the best and the worst fundamentals.
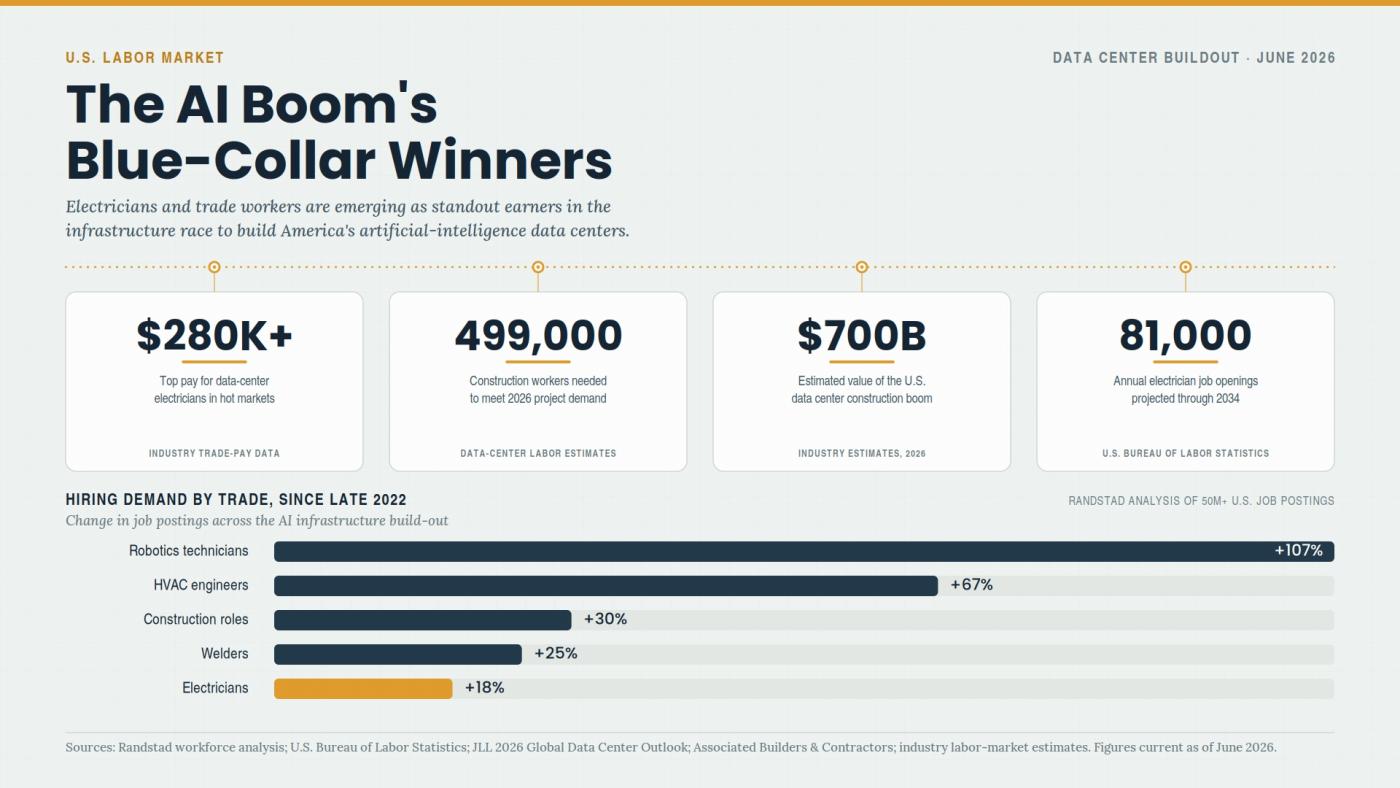
Why Electricians Now Out-Earn Software Engineers
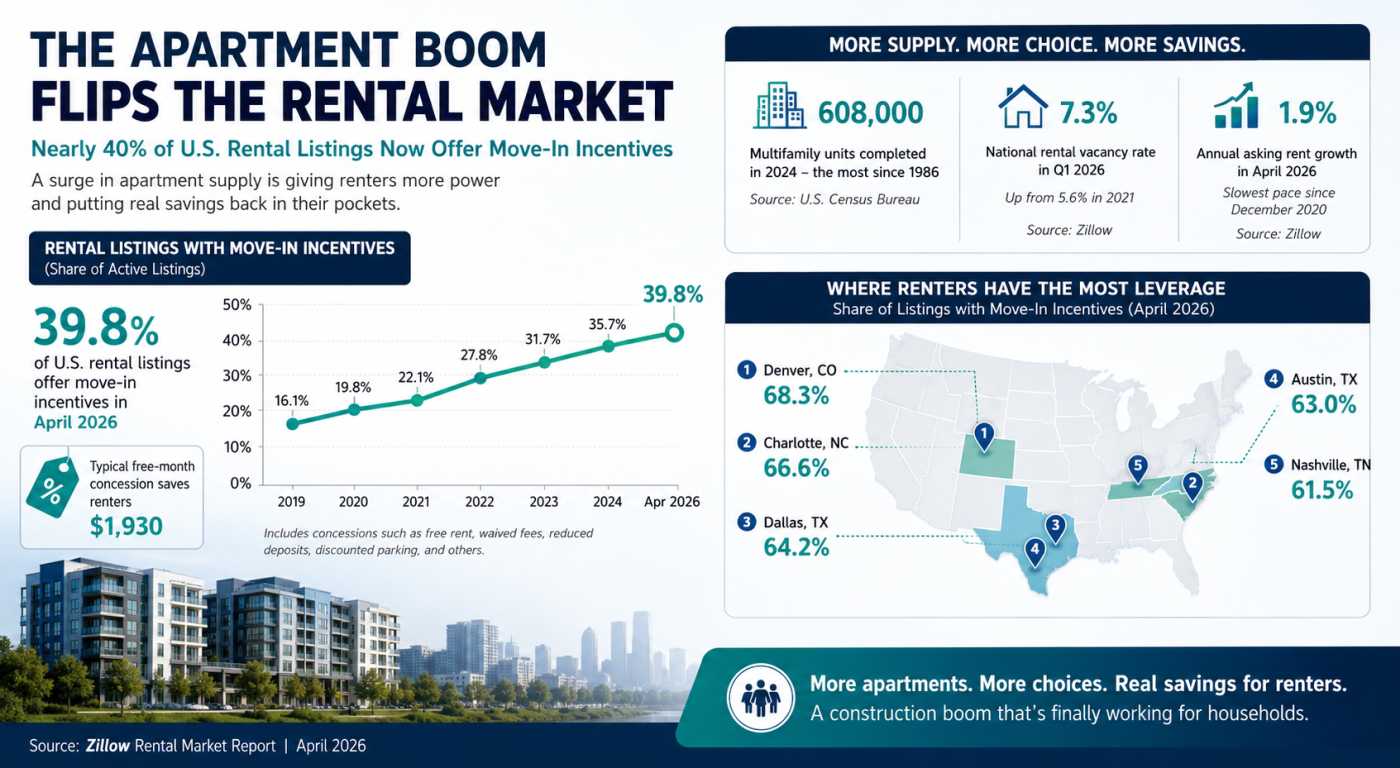
The Apartment Glut Changing America’s Rental Market

Why Community Colleges Are Winning Again
