More about Micron Technology, Inc.
Regulatory Filings for Micron Technology, Inc.
Fundamentals for Micron Technology, Inc.

The Biggest IPO Year Ever: Can Markets Absorb It?

The Jobs Report That Crashed the Rally

The Fed Study Revealing Tomorrow's Investment Themes

America’s Empty Offices Hit Pensions Hard
Technicals for Micron Technology, Inc.


Price Summary
Micron Technology, Inc.'s stock, on 2026-06-10 opened at 905.28, climbed to a high of 957.47, dropped to a low of 883.25, and closed up -1.48% at 891.88, with 53807408 shares traded.For the 52-week period, the stock's highest price is 1079.57, and the lowest price is 104.88.
Technicals
Support and Resistance: The price for MU at 891.88 is supported by the 698.74 level and faces resistance at 1079.57. This range indicates key levels where the price may find buyers near 698.74 and sellers near 1079.57, defining a trading range.
Aroon: The AROON is currently in a neutral position, offering no clear indication of movement up or down. This suggests that the market may be experiencing a period of equilibrium, with no strong trend in play.

Bol. Bands: The BOLL BANDS is showing a neutral reading, with no clear direction indicated for upward or downward movement. This neutral position suggests a possible period of consolidation.

Parabolic SAR: The PSAR continues to signal a bearish outlook, setting a significant resistance level. This resistance could limit upward momentum, indicating that the market may struggle to overcome this bearish pressure in the near term.

Stochastic: The STOCHASTIC is showing a neutral stance, with no definitive indication of an upward or downward trend for MU. This neutral position suggests a period of indecision in the market, making it difficult to predict the next move.

Tripple Moving Agerage: The alignment of the 20, 50, and 100 moving averages suggests a bearish trend, but the wavering slopes of the 20 and 50 SMAs hint at a potential shift. This weakening of momentum could indicate that the bearish trend is running out of steam, possibly leading to a bullish reversal in the near future. Investors should be aware of the possibility of a market turnaround as the current downtrend weakens for Micron Technology, Inc..

When analyzing a company, its fundamentals—such as earnings, management efficiency, and strategic initiatives—must be considered alongside technical data. The context of the industry in which the company operates also plays a key role, as market trends and competitive dynamics can significantly impact performance. By taking a comprehensive approach, combining both fundamental and technical analysis, one can gain a deeper understanding of the company's potential for growth or risk.
If you have enjoyed reading, spread the word:
Good prospects:
Companies with the best and the worst technicals.
Latest Regulatory Filings for SP5
Companies with the best and the worst fundamentals.

Rural Hospitals Buckle Under Private Equity
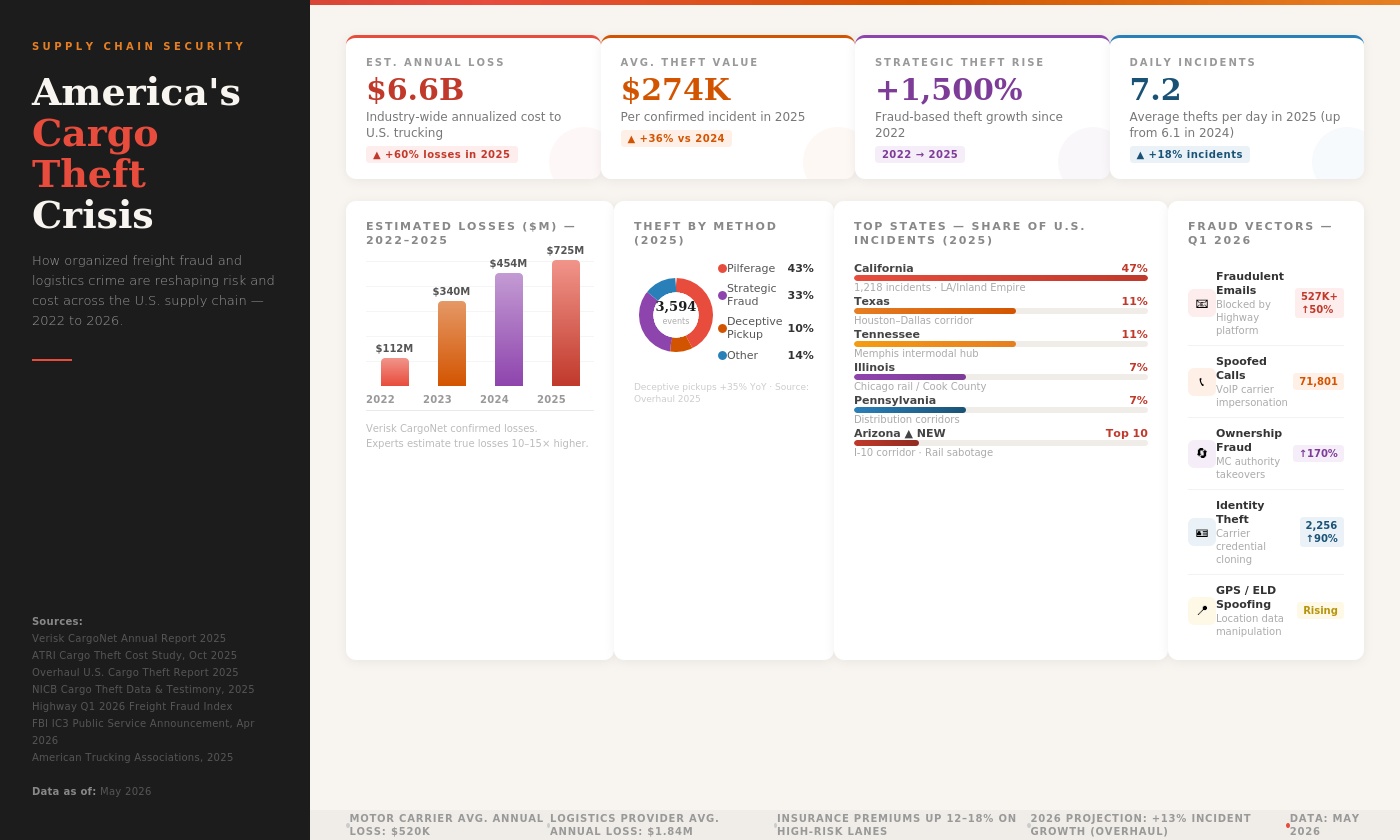
Fake Brokers, Spoofed GPS: Who Pays for Cargo Crime?
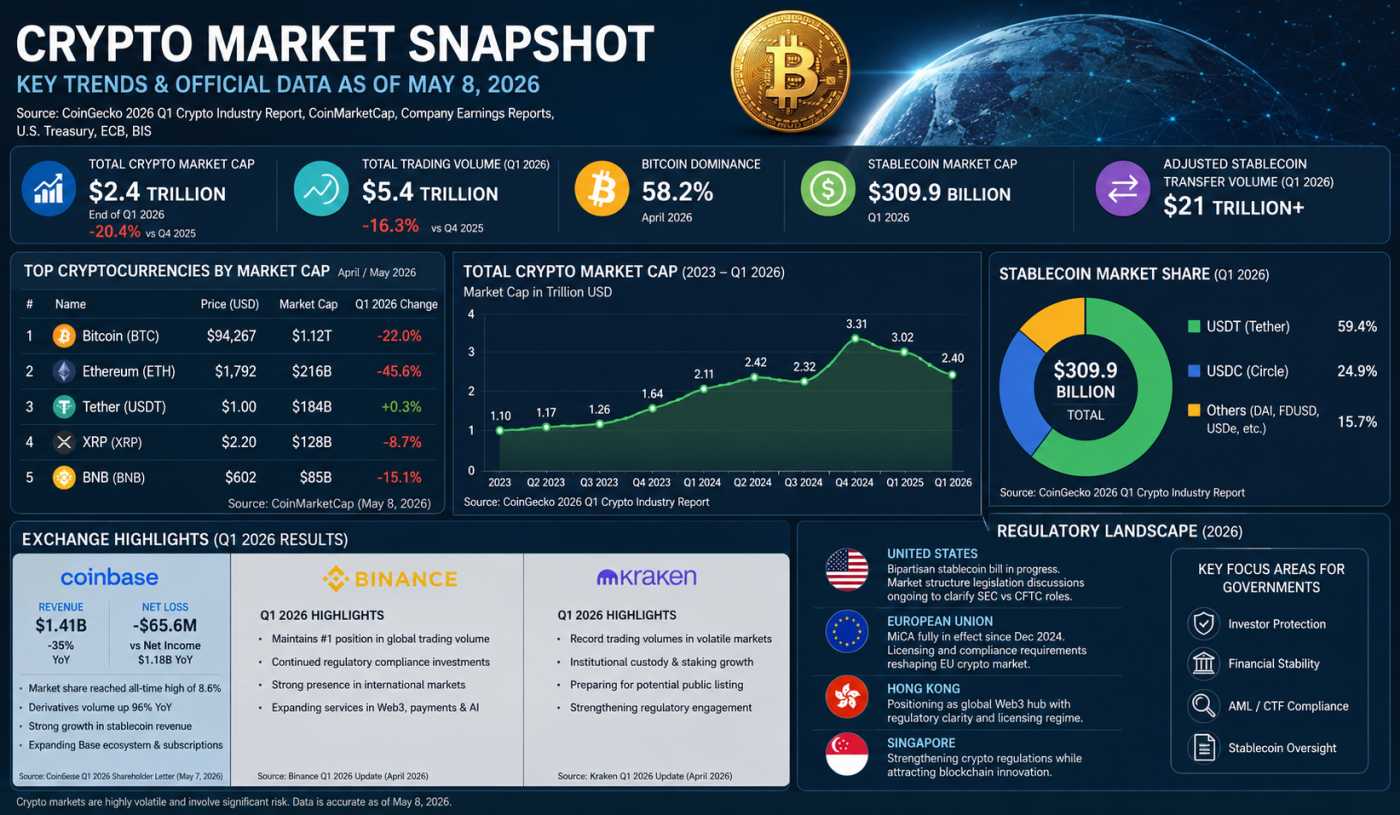
Crypto’s $2.4T Reality Check in 2026
