More about Moody's Corporation
Regulatory Filings for Moody's Corporation
Fundamentals for Moody's Corporation

Diversification Shielded U.S. Banks

Repo, Debt and Risk: The Fed's Untold Warning for 2026

When Losing Money Pays: America's Broken Market Logic

The Hidden Time Bomb in AI Finance
Technicals for Moody's Corporation


Price Summary
2026-07-22, saw MCO's stock open at 493.48, hit a peak of 493.99, fall to a low of 482.96, and close down -0.77% at 489.7, with 1281233 shares changing hands.The stock reached its highest price of 539.61 and its lowest price of 412.23 during the 52-week period.
Technicals
Support and Resistance: The current price of 489.7 is supported at 476.56, with resistance at 500.49. This suggests that the price for MCO might remain between these levels, where 476.56 acts as a floor and 500.49 as a ceiling in the market.
Aroon: The AROON is currently in a neutral position for Moody's Corporation, offering no clear guidance on whether the market is likely to move up or down. This neutral stance suggests that further observation may be necessary before a trend becomes apparent.

Bol. Bands: The BOLL BANDS is currently neutral, offering no clear guidance on market direction. This suggests that the market may be in a state of pause, with no strong trend emerging.

Parabolic SAR: The PSAR remains bearish, reinforcing a resistance level that could restrict any upward movement. This resistance indicates that the market may remain under bearish control, with limited potential for gains.

Stochastic: The current state of the STOCHASTIC is neutral for MCO, providing no clear indication of a trend in either direction. This suggests that the market may be lacking momentum, making it difficult to predict future movements.

Tripple Moving Agerage: The 20, 50, and 100 moving averages are aligned in a bearish pattern, signaling a downtrend. However, the slopes of the 20 and 50 SMAs are starting to waver, suggesting that the bearish momentum may be weakening. This could be an early sign of a potential bullish reversal for MCO, as the market's downward trajectory begins to lose strength and a possible shift towards more positive price action may occur soon.

A comprehensive approach to analyzing a company requires considering both its technical and fundamental aspects. The company's fundamentals, such as its earnings, growth prospects, and financial health, provide a strong foundation for understanding technical indicators. Additionally, examining the industry it operates in helps contextualize the company's position within the broader market. By integrating these factors, one can gain more valuable insights into the company's stock performance and potential investment opportunities.
If you have enjoyed reading, spread the word:
Good prospects:
Companies with the best and the worst technicals.
Latest Regulatory Filings for SP5
Companies with the best and the worst fundamentals.
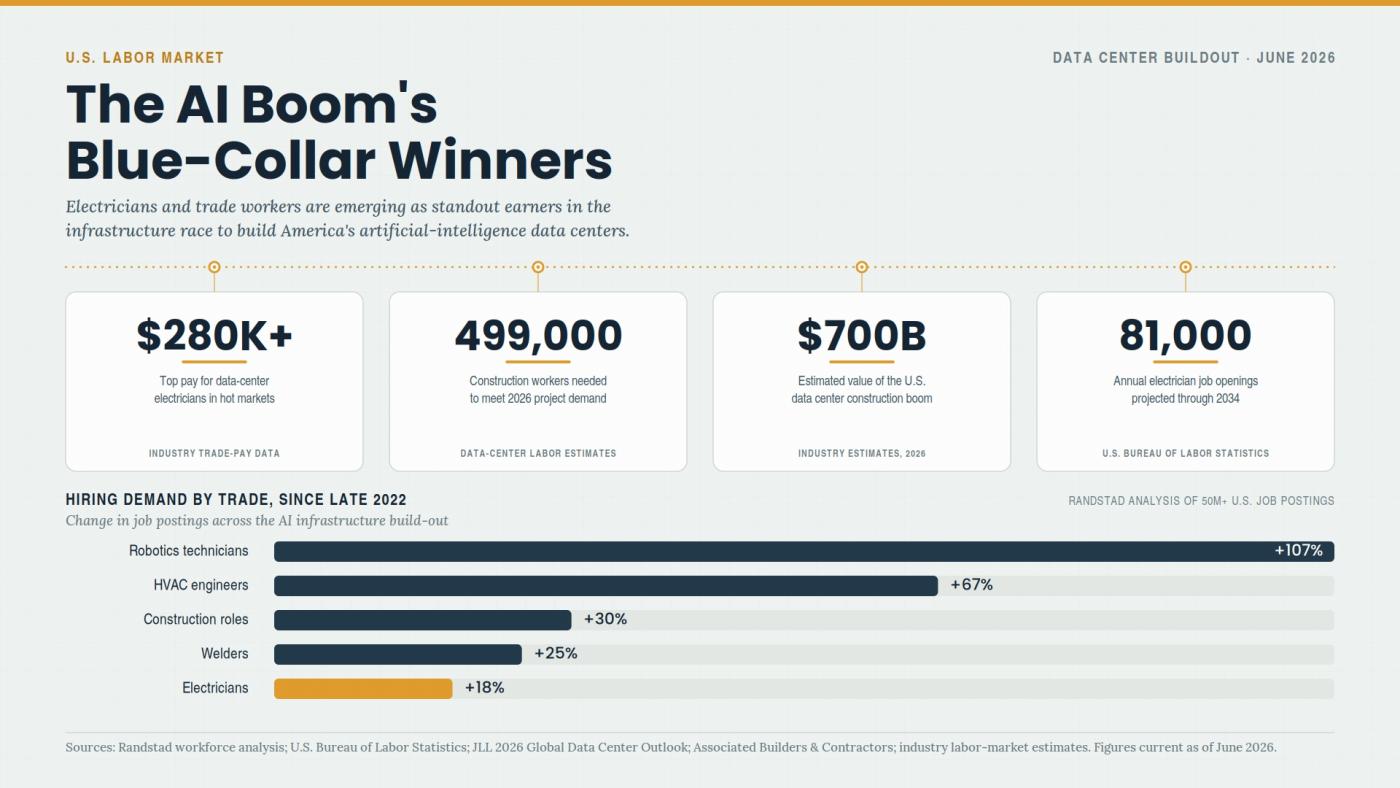
Why Electricians Now Out-Earn Software Engineers

The Apartment Glut Changing America’s Rental Market

Why Community Colleges Are Winning Again
