More about Live Nation Entertainment, Inc.
Regulatory Filings for Live Nation Entertainment, Inc.
Fundamentals for Live Nation Entertainment, Inc.

The Machines That Ate the Grid: Five Centuries of Power Hunger
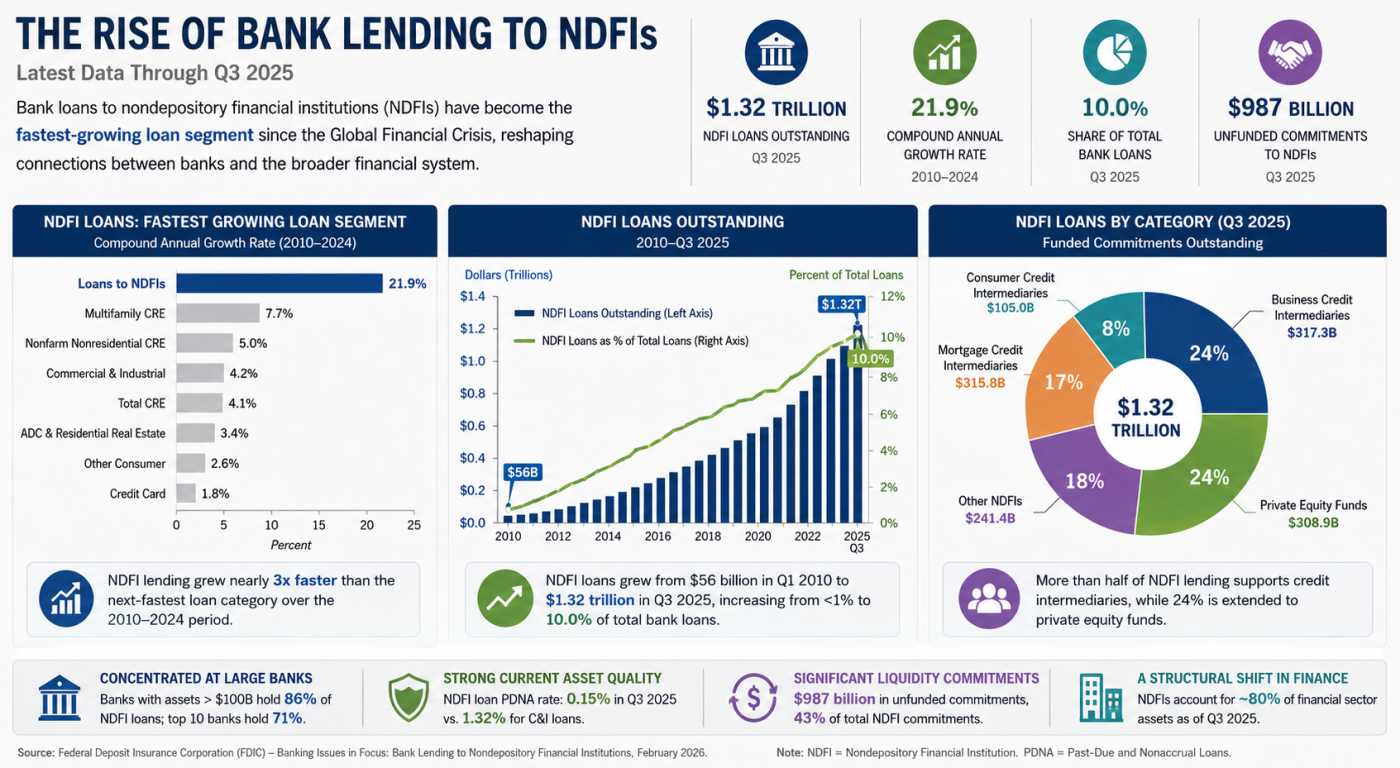
Private Credit’s Secret Banking Backbone Is Growing Faster Than Anyone Expected

America's $5 Trillion Business Handoff Has Already Begun

The Repair Economy Boom in Rural America
Technicals for Live Nation Entertainment, Inc.


Price Summary
On 2026-05-08, LYV's stock began at 166.57, peaked at 166.79, dipped to 162.25, and closed up -1.98% at 163.28, with a volume of 2266549 shares.Over the course of 52 weeks, the stock peaked at 174.06 and hit a low of 125.61.
Technicals
Support and Resistance: At 163.28, the price for LYV is supported at 162.67 and resisted at 167.82. This indicates a trading range where 162.67 serves as a support level, potentially preventing further decline, while 167.82 could limit upward movement.
Aroon: The AROON is neutral, showing no definitive signals of a trend either upward or downward. This neutral stance indicates a period of market indecision, where the direction is unclear.

Bol. Bands: The current state of the BOLL BANDS is neutral, offering no clear signals of movement in either direction. This suggests a potential pause in market activity, with no strong trend emerging at the moment.

Parabolic SAR: The PSAR remains bullish, reinforcing a significant support level. This steady support suggests that the market's upward trend may continue, providing a solid foundation for potential gains for LYV. Investors might see this as an opportunity to capitalize on the ongoing bullish sentiment.

Stochastic: The current state of the STOCHASTIC is neutral for LYV, providing no clear indication of a trend in either direction. This suggests that the market may be lacking momentum, making it difficult to predict future movements.

Tripple Moving Agerage: The 20, 50, and 100 moving averages for LYV are aligned in a bearish pattern, suggesting a downtrend. However, the wavering slopes of the 20 and 50 SMAs indicate that the bearish momentum may be losing strength. This could be a sign that a bullish reversal is on the horizon, as the market's current downward trajectory begins to falter, potentially paving the way for a new uptrend.

When assessing a company's technical performance, such as stock price fluctuations and trading volume, it is crucial to first examine its fundamentals. These fundamentals include financial health, profitability, and growth potential. Additionally, understanding the industry's dynamics, including competitive pressures and market trends, is key to contextualizing the company's performance. By integrating these factors, a more comprehensive and meaningful analysis can be conducted, leading to more informed investment decisions.
DISCLAIMER: We provide information and our musings based on events, but nothing on this site can be considered professional advice of any kind.
If you have enjoyed reading, spread the word:
Good prospects:
Companies with the best and the worst technicals.
Latest Regulatory Filings for SP5
Companies with the best and the worst fundamentals.

Debt, Deficits & Disaster: The Bond Market Crisis

Not Wall Street, But AI: The Real Force Democratizing Finance Across America

When Flooding Pays: A New Financial Bet
