
The Machines That Ate the Grid: Five Centuries of Power Hunger
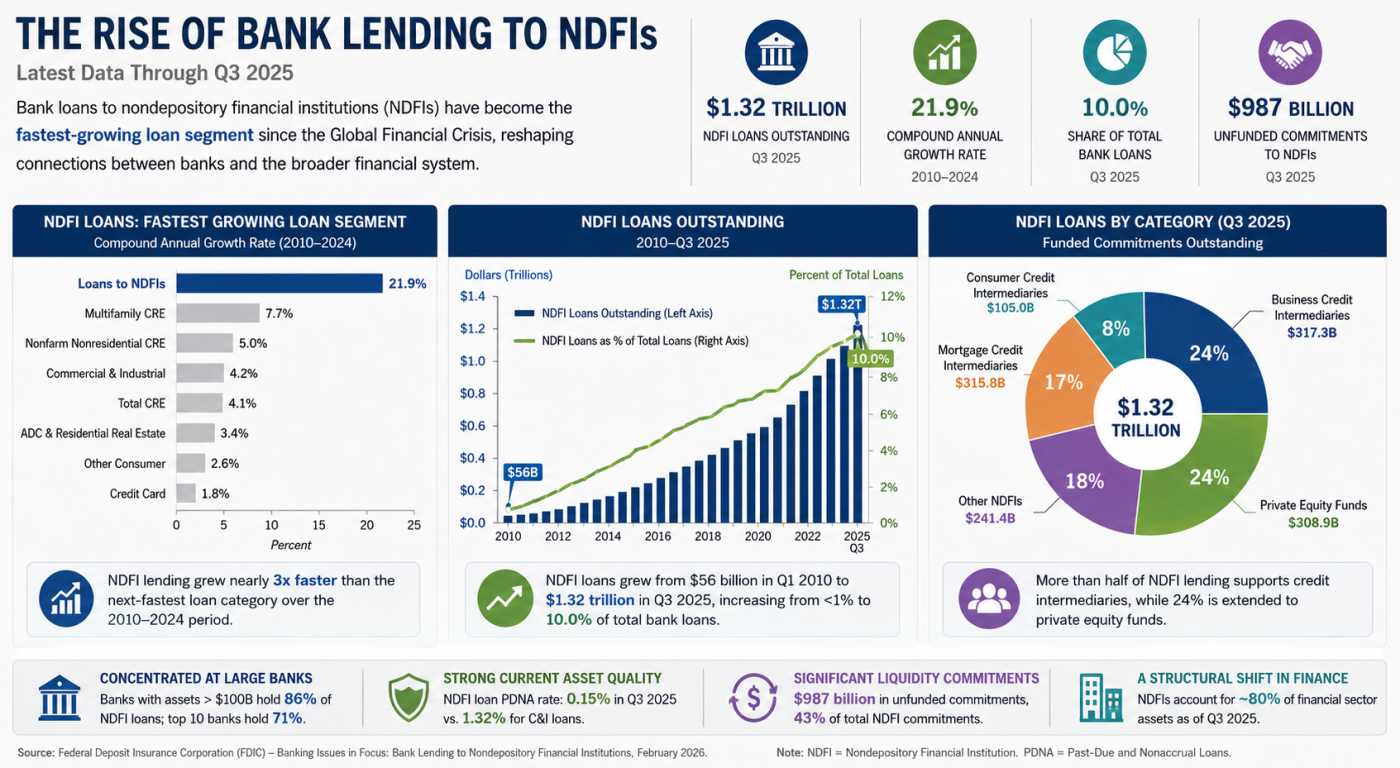
Private Credit’s Secret Banking Backbone Is Growing Faster Than Anyone Expected

America's $5 Trillion Business Handoff Has Already Begun

The Repair Economy Boom in Rural America
Technicals for KeyCorp


Price Summary
KeyCorp's stock started trading at 21.8 on 2026-05-08, climbed to 21.84, fell to 21.53, and closed -0.92% down at 21.6, with 6498019 shares traded.The stock's highest price in the past 52 weeks is 23.21, while its lowest price during the same period is 15.61.
According to 19 analysts, the future price is anticipated to vary between 22.0 and 43.0, with an average expected price of around 24.92105.
Technicals
Support and Resistance: The price of 21.6 is supported at 21.37 and faces resistance at 22.1. This range suggests key levels for KEY where the price may stabilize, with 21.37 acting as a support and 22.1 as a cap on gains.
Aroon: The AROON is currently in a neutral position for KeyCorp, offering no clear guidance on whether the market is likely to move up or down. This neutral stance suggests that further observation may be necessary before a trend becomes apparent.

Bol. Bands: The current state of the BOLL BANDS is neutral, providing no clear signals for either an upward or downward movement. This indicates that the market may be in a state of equilibrium, with no strong momentum in either direction.

Parabolic SAR: The PSAR has recently reversed from bullish to bearish, hinting at a possible market downturn. If this shift is supported by other trends, it could represent a significant bearish signal for KEY. Investors should be cautious and seek further confirmation before making decisions.

Stochastic: The STOCHASTIC is in a neutral stance, with no clear signals for movement up or down. This neutral position indicates a potential period of consolidation or uncertainty in the market.

Tripple Moving Agerage: The Tripple MOVING AVG is in a neutral stance, not pointing to a clear trend in either direction. This suggests that the market may be lacking strong momentum, making it difficult to predict the next move.

To derive valuable insights from a company's technical performance, it is essential to first understand its fundamentals. This includes its financial health, business model, and market share. Equally important is the industry context, such as competition, consumer demand, and market trends. By examining these aspects together, investors can gain a more comprehensive view of how the company's stock behaves and whether it's aligned with its underlying value.
DISCLAIMER: We provide information and our musings based on events, but nothing on this site can be considered professional advice of any kind.
If you have enjoyed reading, spread the word:
Good prospects:
Companies with the best and the worst technicals.
Latest Regulatory Filings for SP5
Companies with the best and the worst fundamentals.

Debt, Deficits & Disaster: The Bond Market Crisis

Not Wall Street, But AI: The Real Force Democratizing Finance Across America

When Flooding Pays: A New Financial Bet
