More about Interactive Brokers Group, Inc.
Regulatory Filings for Interactive Brokers Group, Inc.
Fundamentals for Interactive Brokers Group, Inc.

Diversification Shielded U.S. Banks

Repo, Debt and Risk: The Fed's Untold Warning for 2026

When Losing Money Pays: America's Broken Market Logic

The Hidden Time Bomb in AI Finance
Technicals for Interactive Brokers Group, Inc.



Price Summary
On 2026-07-22, Interactive Brokers Group, Inc.'s stock started at 92.93, soared to 95.54, dropped to 92.18, and finished the day 0.61% up at 93.5, with a trading volume of 5761647 shares.Throughout the 52-week period, the stock hit a high of 97.41 and a low of 60.16.
Technicals
Support and Resistance: The current price for IBKR is 93.5, supported at 88.69 with resistance at 93.56. This indicates a trading range where 88.69 might prevent further declines, while 93.56 could hinder additional gains.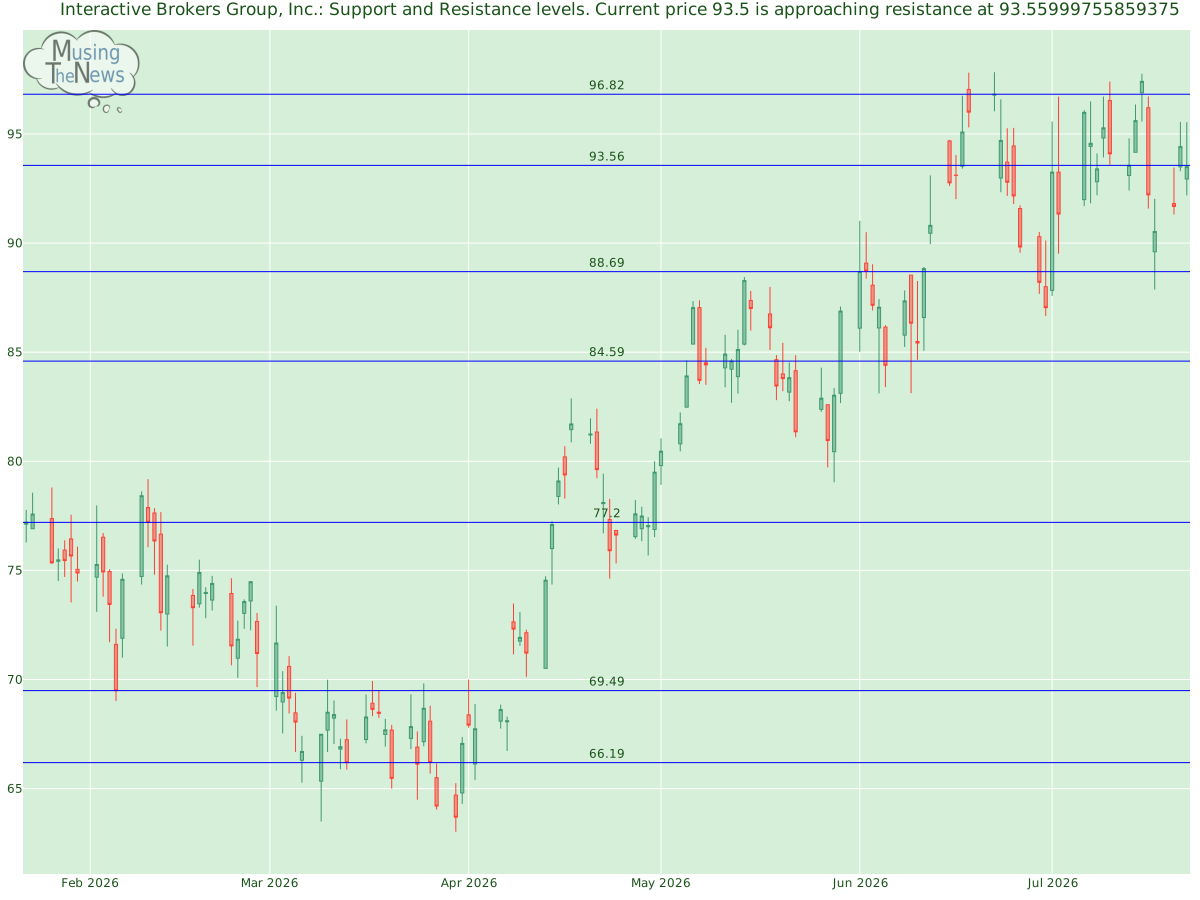
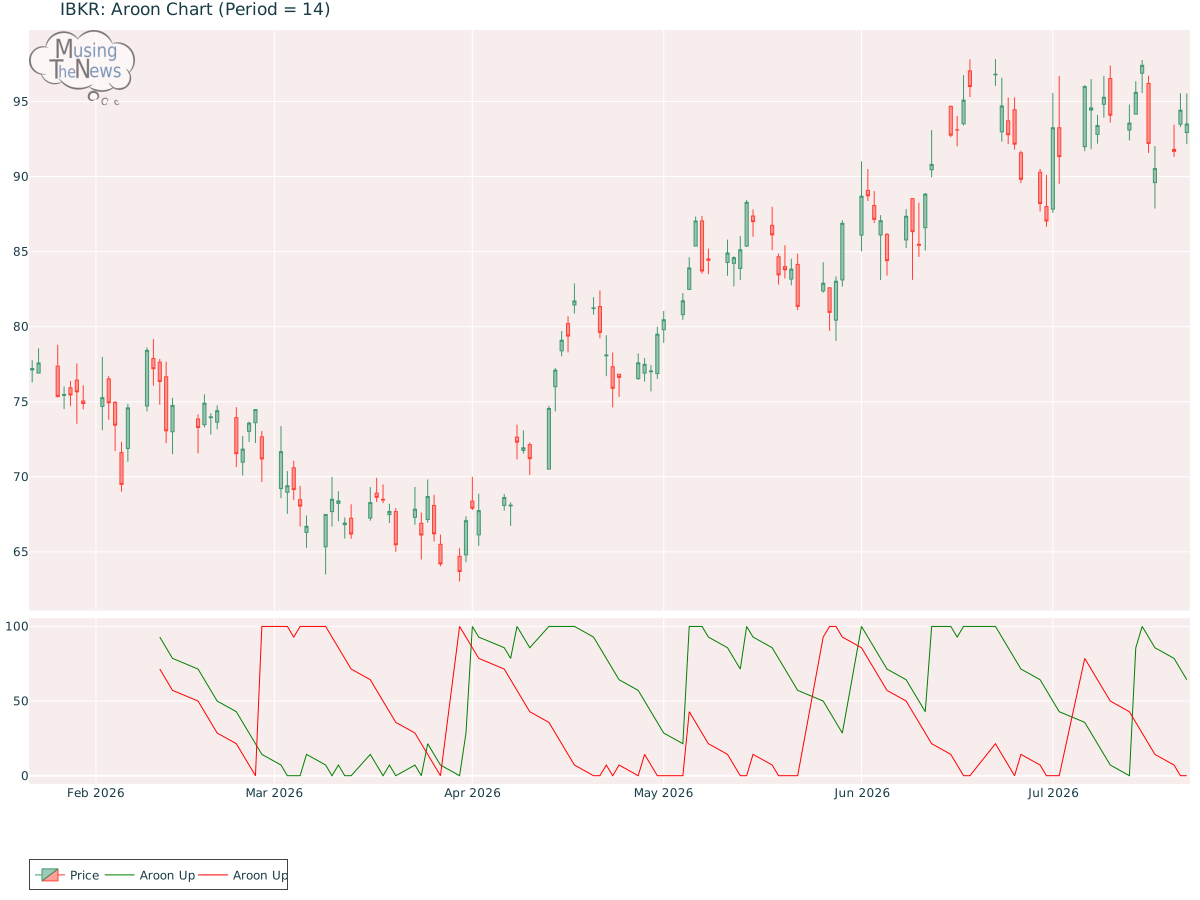
Aroon: The current state of the AROON is neutral, with no clear trend direction indicated. This lack of directional bias suggests that the market may be in a phase of consolidation or uncertainty.
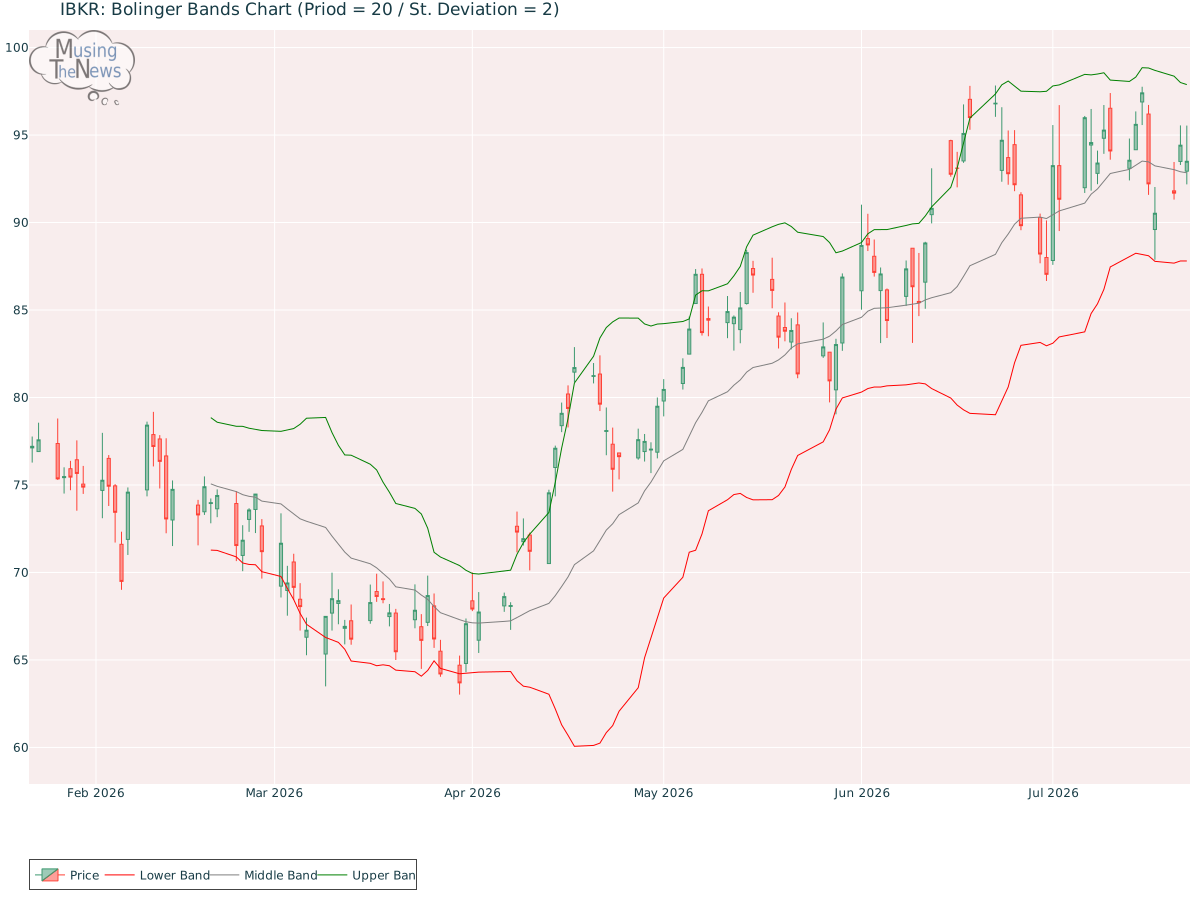
Bol. Bands: The BOLL BANDS is showing a neutral stance, not indicating a clear upward or downward trend for Interactive Brokers Group, Inc.. This suggests a period of market balance, where neither side is showing dominance.
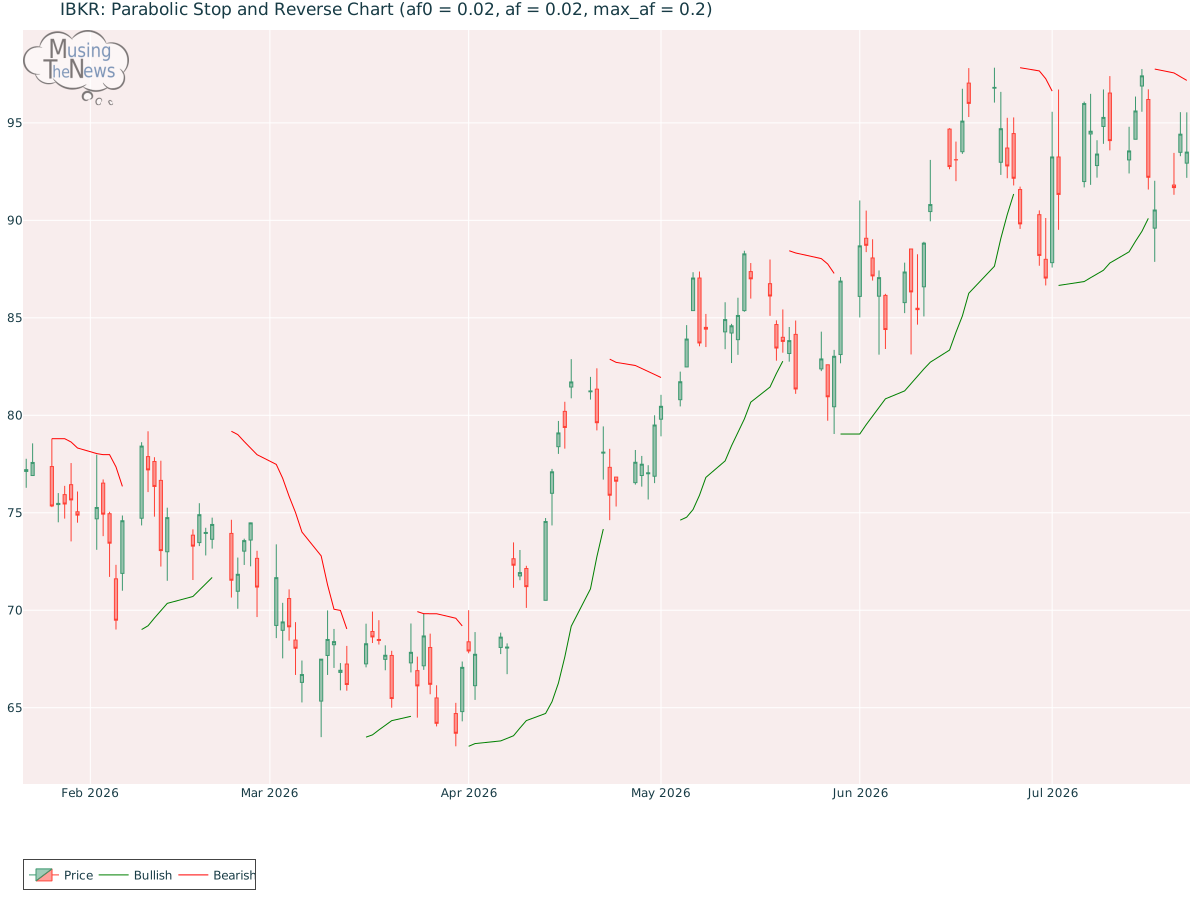
Parabolic SAR: The PSAR remains bearish, reinforcing a resistance level that could restrict any upward movement. This resistance indicates that the market may remain under bearish control, with limited potential for gains.
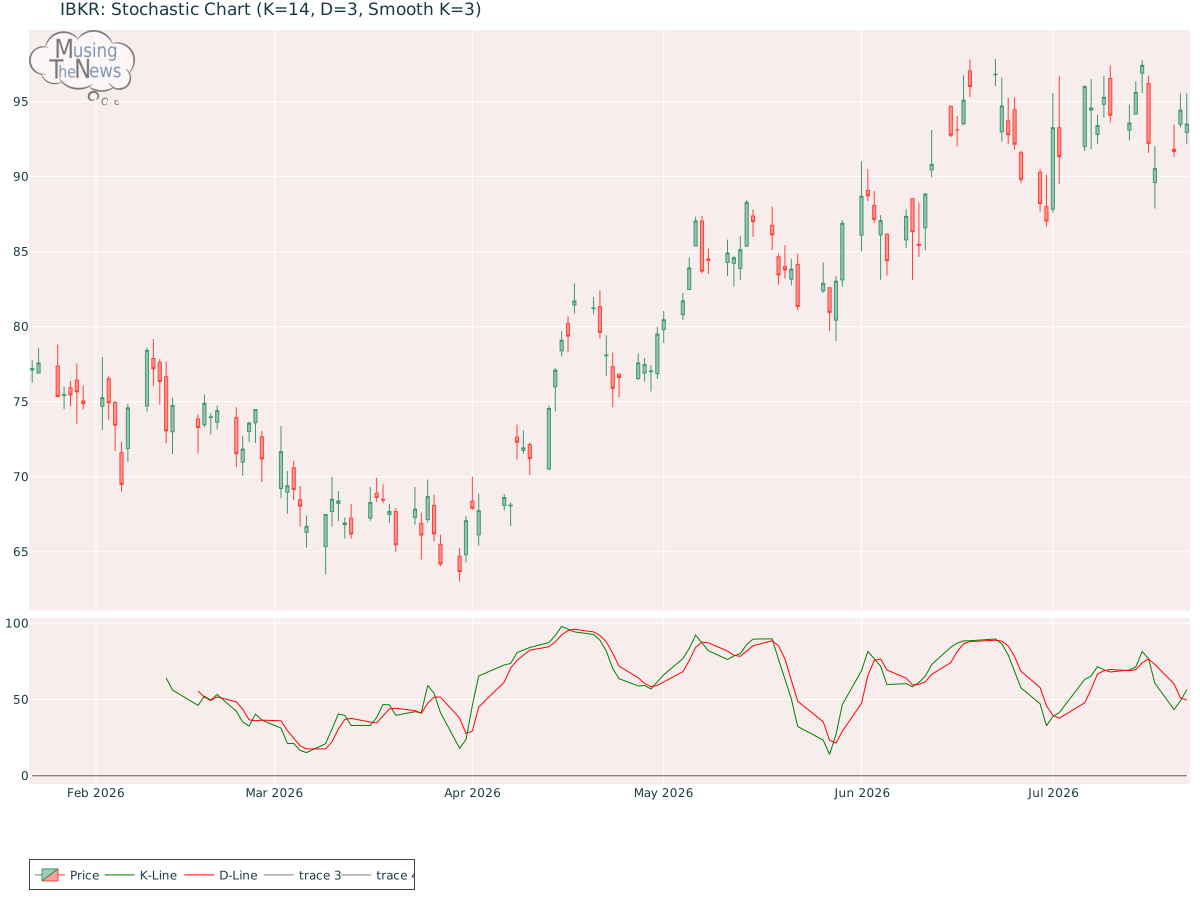
Stochastic: The STOCHASTIC is currently neutral, offering no clear guidance on market direction. This suggests that the market may be in a state of pause, with no strong trend emerging.
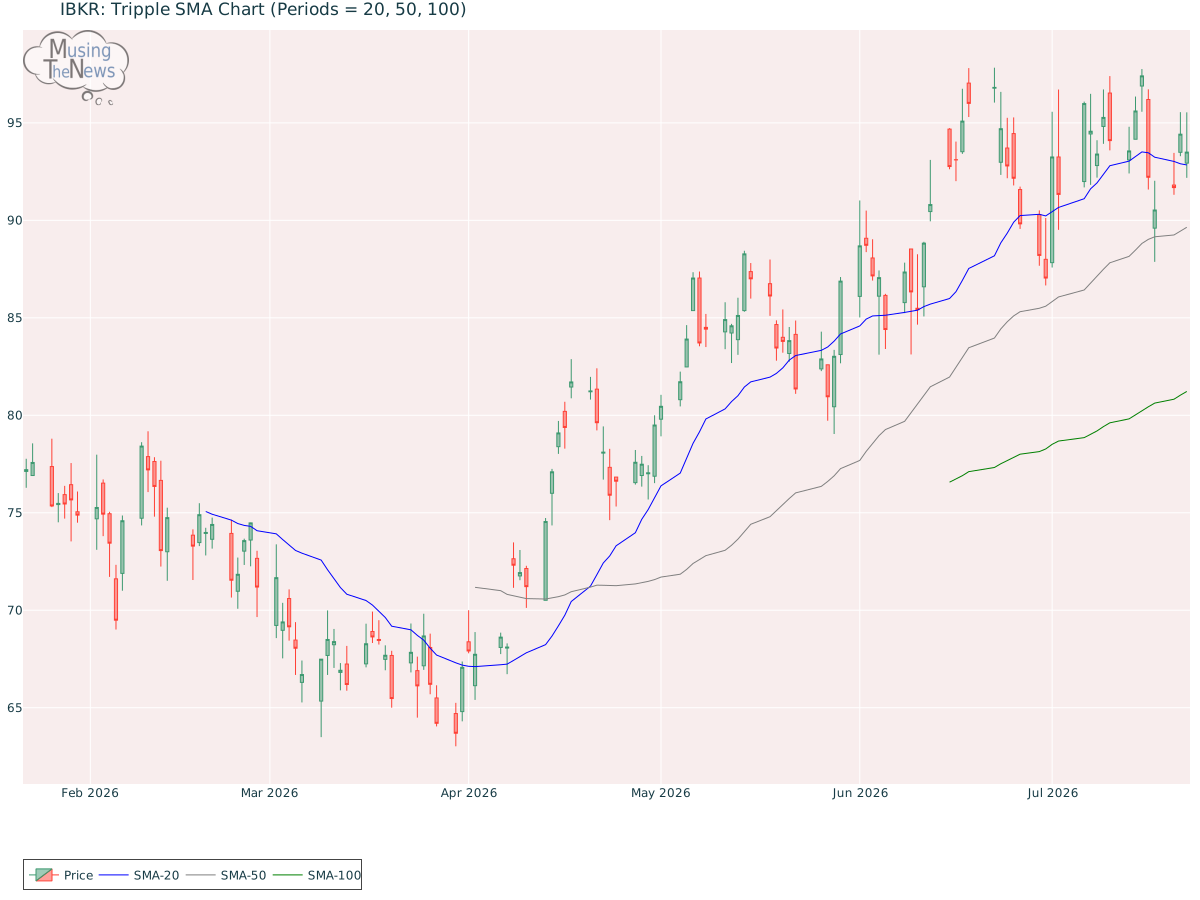
Tripple Moving Agerage: The Tripple MOVING AVG is showing a neutral stance, not indicating a clear upward or downward trend for Interactive Brokers Group, Inc.. This suggests a period of market balance, where neither side is showing dominance.
When assessing a company's technical performance, such as stock price fluctuations and trading volume, it is crucial to first examine its fundamentals. These fundamentals include financial health, profitability, and growth potential. Additionally, understanding the industry's dynamics, including competitive pressures and market trends, is key to contextualizing the company's performance. By integrating these factors, a more comprehensive and meaningful analysis can be conducted, leading to more informed investment decisions.
If you have enjoyed reading, spread the word:
Good prospects:
Companies with the best and the worst technicals.
Latest Regulatory Filings for SP5
Companies with the best and the worst fundamentals.
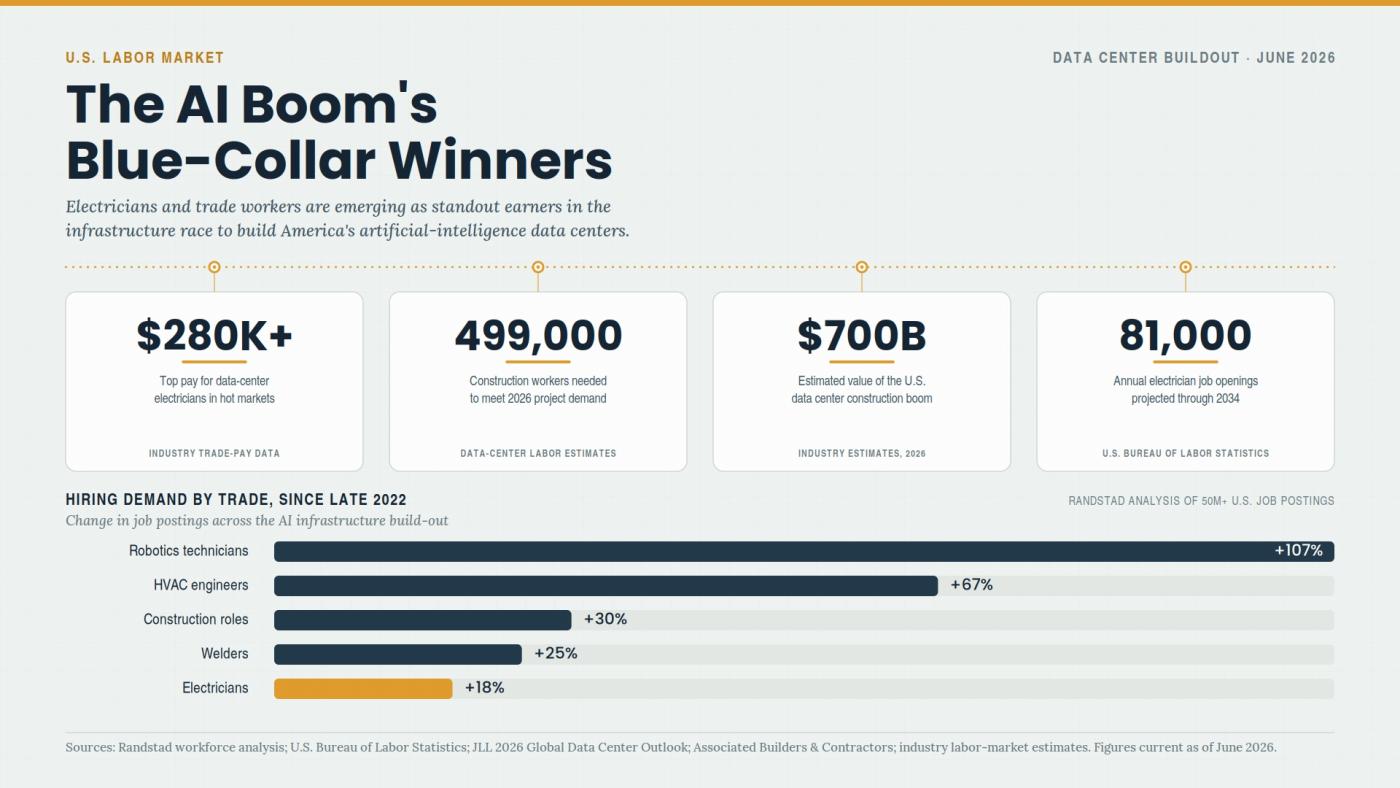
Why Electricians Now Out-Earn Software Engineers
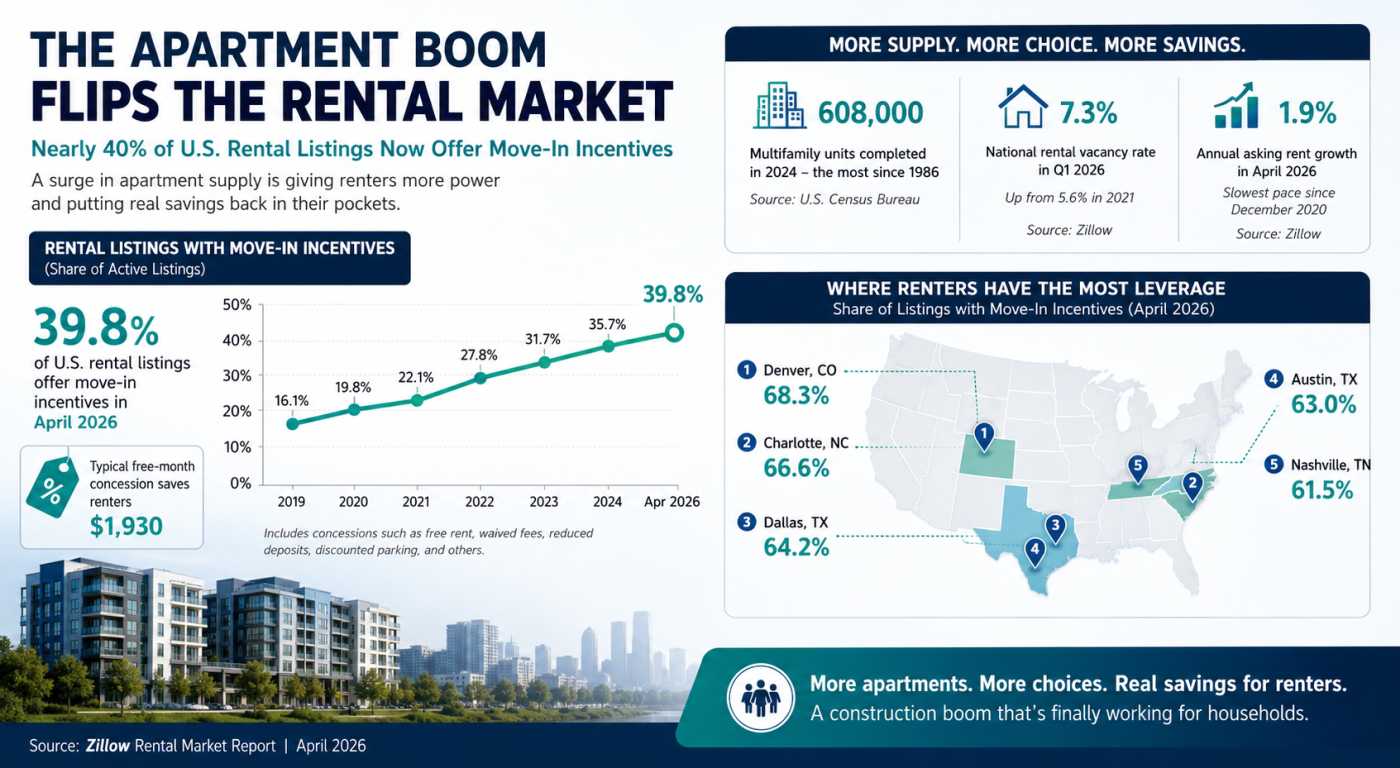
The Apartment Glut Changing America’s Rental Market
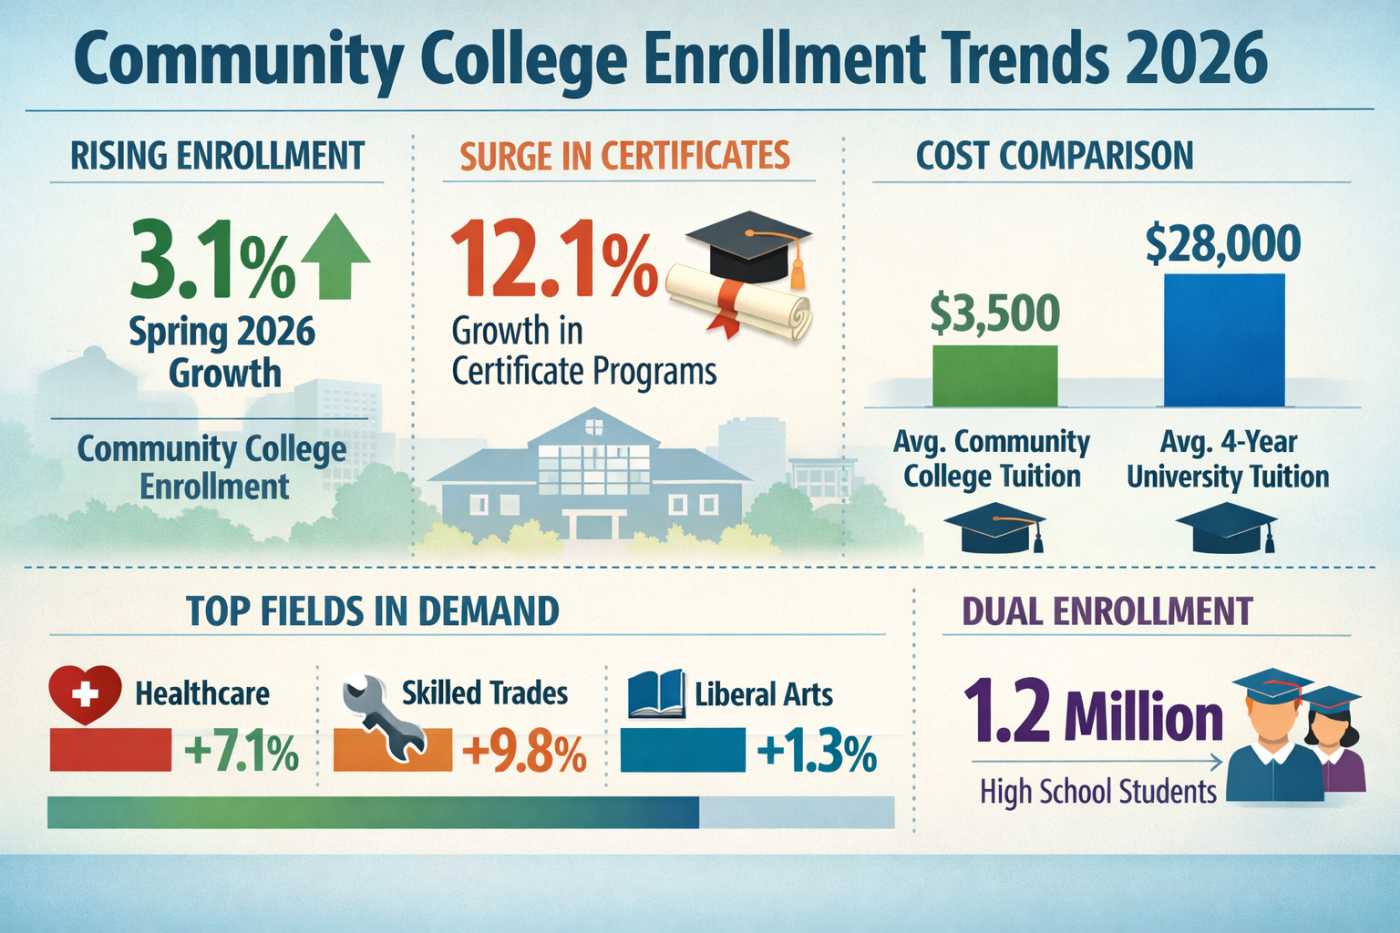
Why Community Colleges Are Winning Again