More about Howmet Aerospace Inc.
Regulatory Filings for Howmet Aerospace Inc.
Fundamentals for Howmet Aerospace Inc.

The Machines That Ate the Grid: Five Centuries of Power Hunger
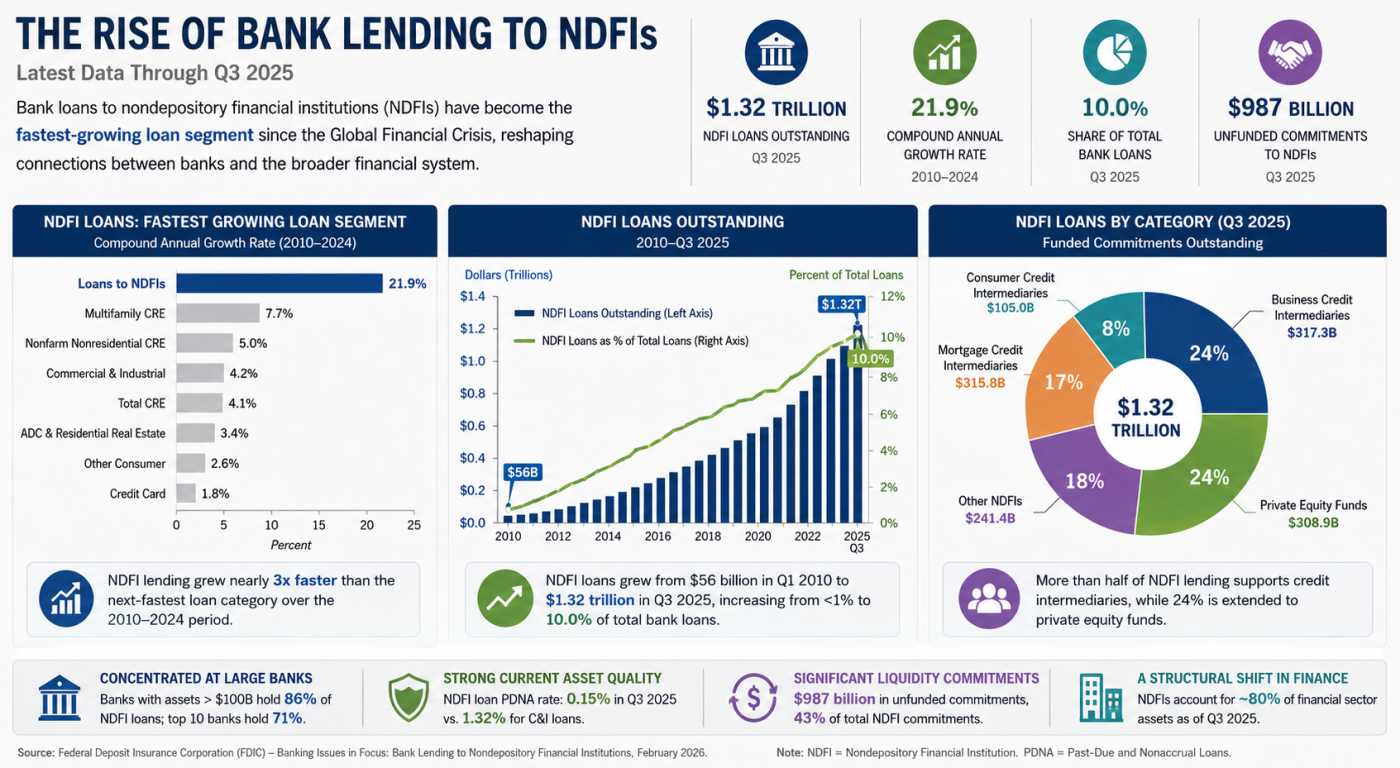
Private Credit’s Secret Banking Backbone Is Growing Faster Than Anyone Expected

America's $5 Trillion Business Handoff Has Already Begun

The Repair Economy Boom in Rural America
Technicals for Howmet Aerospace Inc.


Price Summary
On 2026-05-08, Howmet Aerospace Inc.'s stock began at 273.42, peaked at 275.74, bottomed at 269.21, and closed -1.05% lower at 270.56, with a volume of 2570855 shares.The top price for the stock in the last 52 weeks is 272.54, with the bottom price being 156.96.
Technicals
Aroon: The AROON is showing a neutral stance, not indicating a clear upward or downward trend for Howmet Aerospace Inc.. This suggests a period of market balance, where neither side is showing dominance.

Bol. Bands: The asset's price remains above the upper Bollinger Band, reflecting strong upward momentum since its previous move. This situation suggests that the asset could be overbought, with traders potentially seeing this as a sign of ongoing strength. However, the prolonged position above the band could also indicate that a correction or reversal is likely in the near future.

Parabolic SAR: The PSAR maintains a bullish outlook, reinforcing a support level that could help uphold the market's upward trend. This suggests that the market is likely to continue climbing, with the support providing a solid base for further gains.

Stochastic: HWM's stochastic indicator reflects a bullish trend, with the K-line positioned above the D-line and surpassing the 80 threshold. This setup suggests strong upward momentum, indicating that the market may continue to rise. Investors could interpret this as a positive signal for further gains.

Tripple Moving Agerage: The current state of the Tripple MOVING AVG is neutral, with no clear trend direction indicated. This lack of directional bias suggests that the market may be in a phase of consolidation or uncertainty.

Understanding a company's fundamentals—such as revenue, earnings, and debt levels—provides a solid foundation for analyzing its technical performance. Similarly, knowledge of the industry, including key competitors and market trends, is critical. Combining this fundamental analysis with technical indicators like stock charts, moving averages, and trading volume enables a more comprehensive approach to evaluating the company's overall health and potential future performance.
DISCLAIMER: We provide information and our musings based on events, but nothing on this site can be considered professional advice of any kind.
If you have enjoyed reading, spread the word:
Good prospects:
Companies with the best and the worst technicals.
Latest Regulatory Filings for SP5
Companies with the best and the worst fundamentals.

Debt, Deficits & Disaster: The Bond Market Crisis

Not Wall Street, But AI: The Real Force Democratizing Finance Across America

When Flooding Pays: A New Financial Bet
