More about The Hershey Company
Regulatory Filings for The Hershey Company
Fundamentals for The Hershey Company
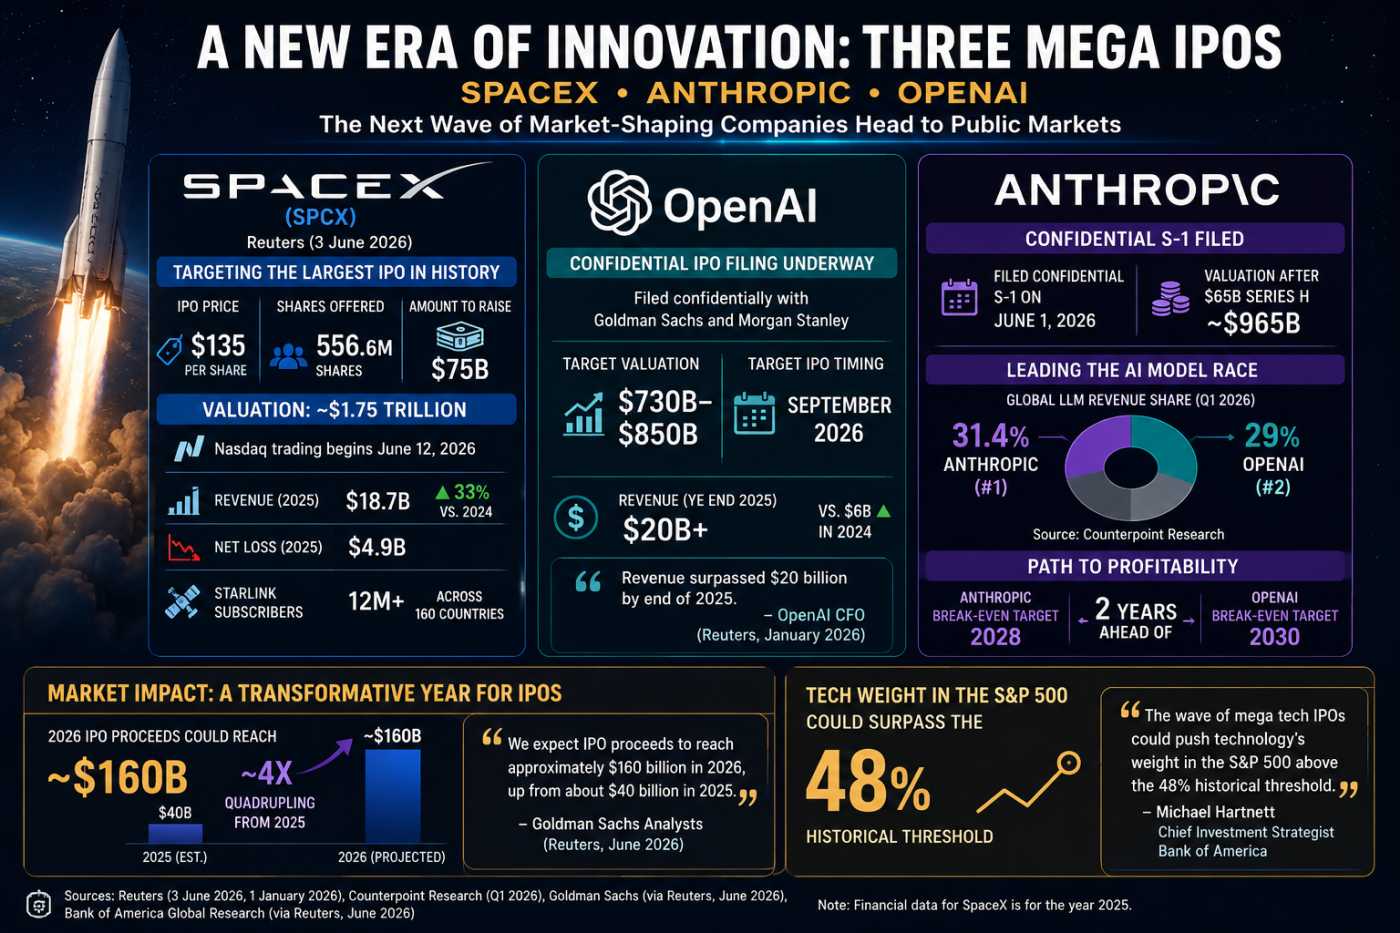
The Biggest IPO Year Ever: Can Markets Absorb It?
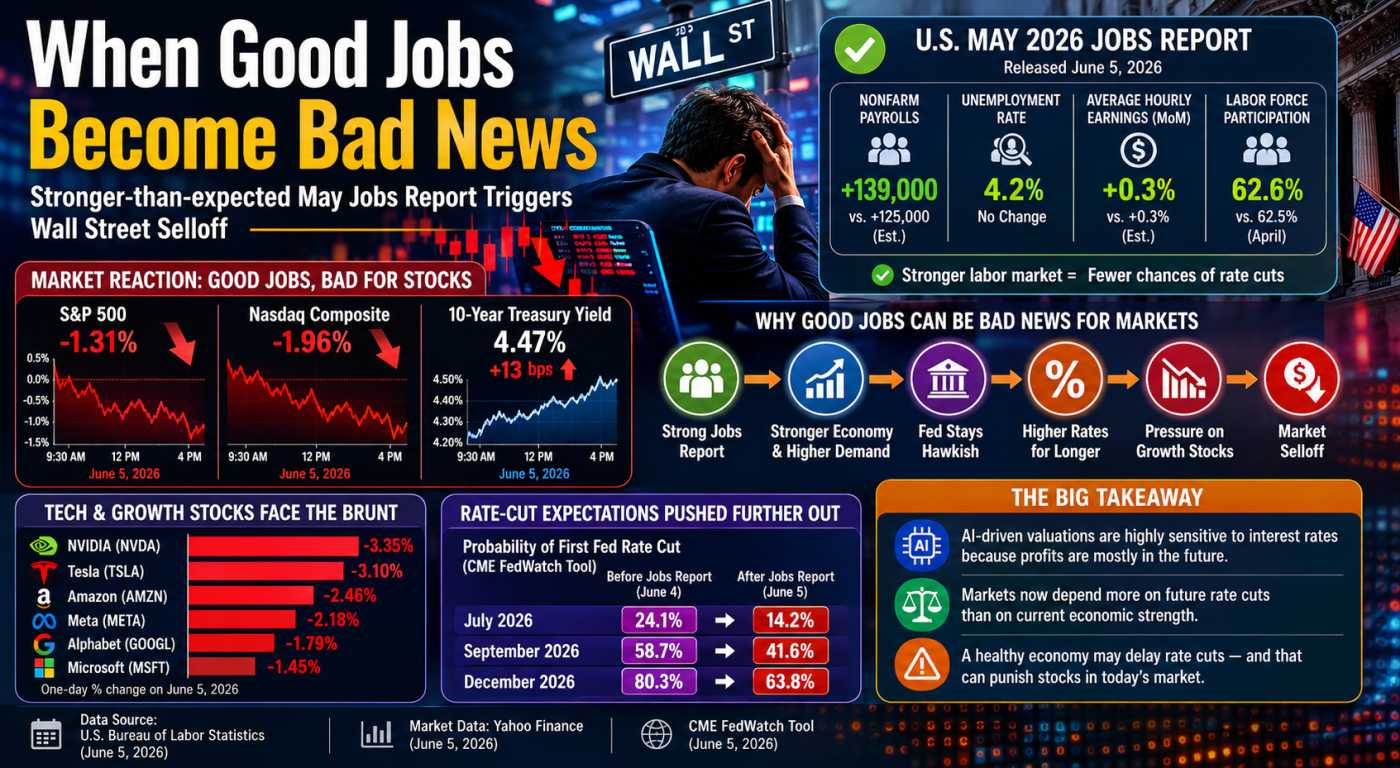
The Jobs Report That Crashed the Rally

The Fed Study Revealing Tomorrow's Investment Themes
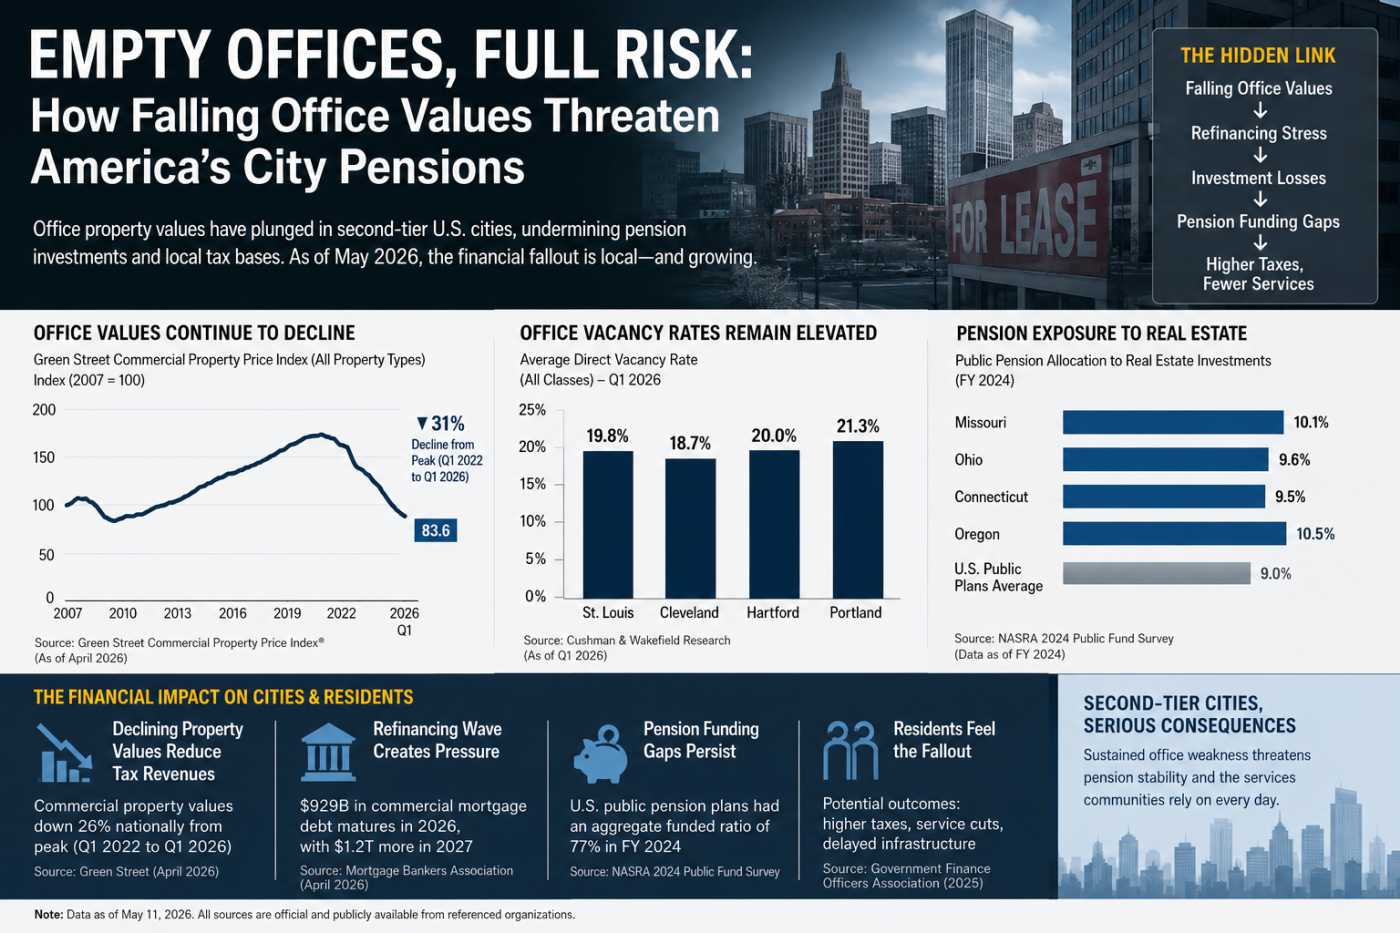
America’s Empty Offices Hit Pensions Hard
Technicals for The Hershey Company


Price Summary
The Hershey Company's stock began trading at 176.3 on 2026-06-10, soared to 178.38, dipped to 173.88, and finished the day 0.18% higher at 176.61, with 1953796 shares exchanged.During the past 52 weeks, the highest stock price was 236.28, and the lowest was 161.95.
Technicals
Aroon: The current reading of the AROON is neutral for HSY, with no clear signals for an upward or downward trend. This indicates that the market may be in a state of uncertainty, with no dominant force driving the direction.

Bol. Bands: The BOLL BANDS is in a neutral stance, with no clear direction indicated for the market. This lack of clarity suggests that the market may be in a state of equilibrium for HSY, with no strong trend emerging.

Parabolic SAR: The PSAR maintains its bearish stance, establishing a resistance level that could cap any attempts at upward movement. This persistent bearish outlook suggests that the market may continue to face downward pressure, with resistance preventing significant gains.

Stochastic: The Stochastic K-line's drop beneath the D-line and under 20 suggests a mildly bearish market condition. This setup indicates that the market may face some downside risk, though the bearish tone is moderate. Investors should consider this as a potential early indicator of a shift for The Hershey Company.

Tripple Moving Agerage: The moving averages for HSY for the 20-50-100 periods point to a bullish trend, but the slopes of the faster averages suggest this strength may be waning. The potential for a reversal is becoming apparent, as the shorter-term averages indicate that the upward momentum could be weakening, signaling a possible trend change.

When evaluating a company's technical indicators like price trends and trading volume, it's important to also assess its fundamentals. Key factors include the company's profitability, growth rate, and financial stability. Furthermore, considering the industry within which the company operates provides additional context, as factors like competition and market demand can affect performance. By combining this analysis, you can make more informed judgments about the company's future prospects.
If you have enjoyed reading, spread the word:
Good prospects:
Companies with the best and the worst technicals.
Latest Regulatory Filings for SP5
Companies with the best and the worst fundamentals.

Rural Hospitals Buckle Under Private Equity
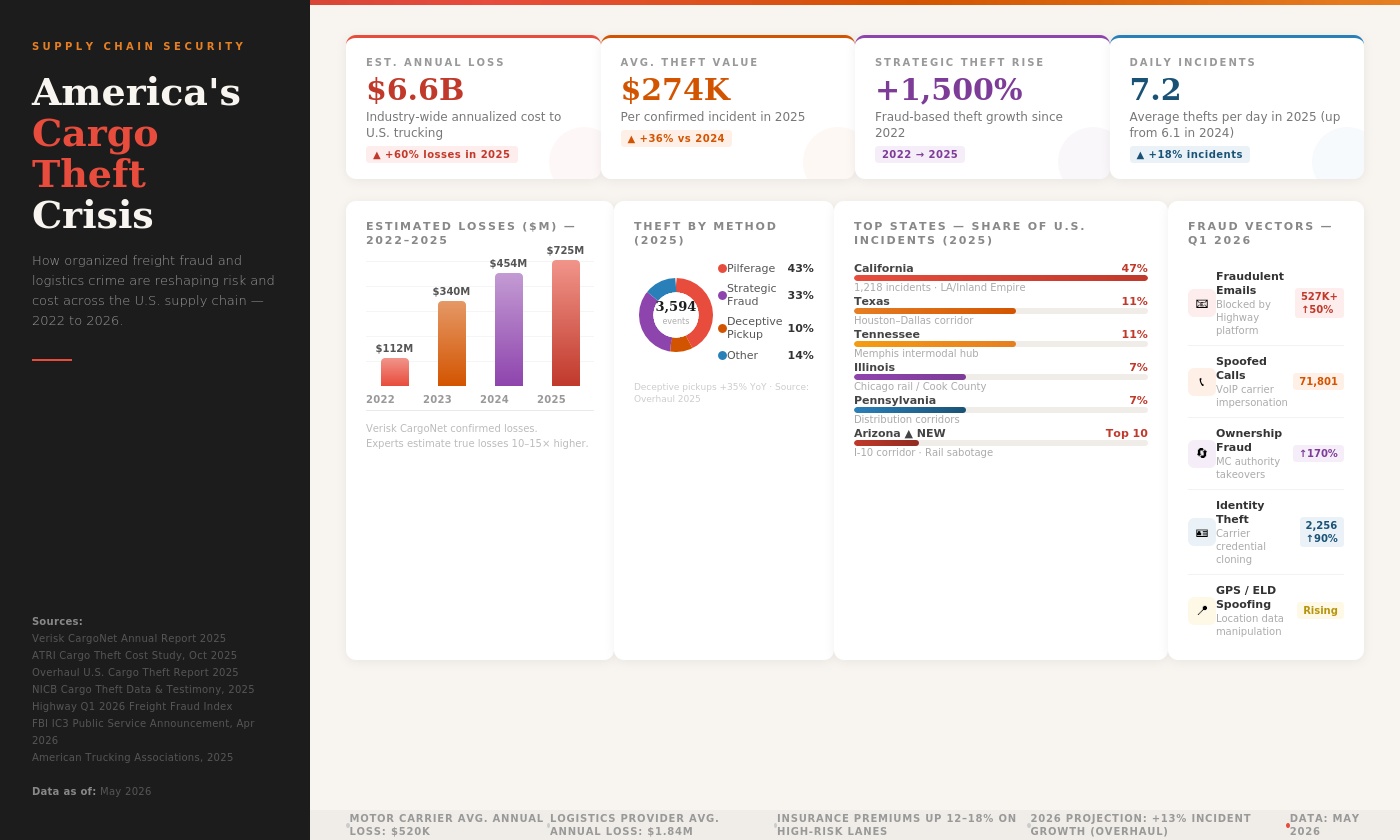
Fake Brokers, Spoofed GPS: Who Pays for Cargo Crime?
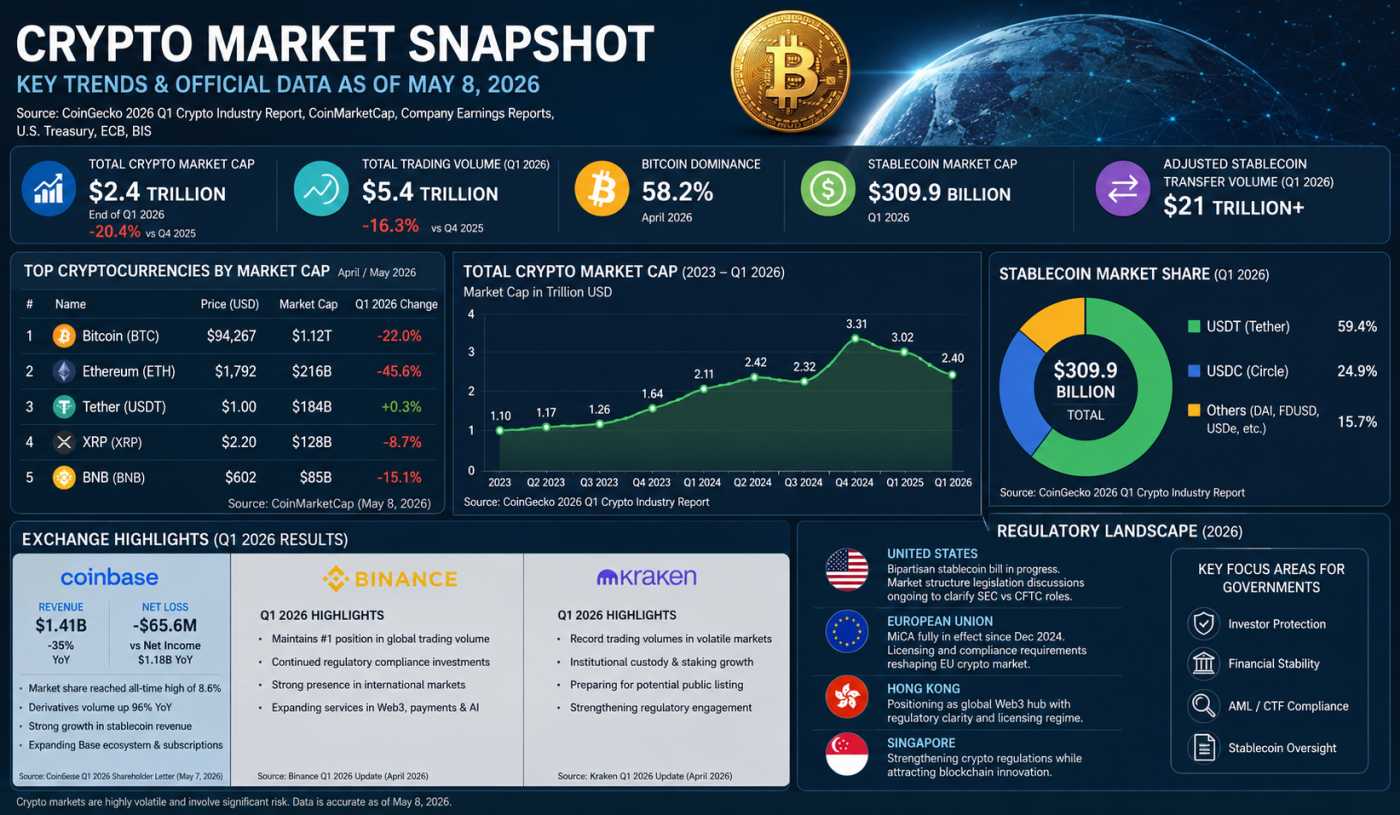
Crypto’s $2.4T Reality Check in 2026
