
Diversification Shielded U.S. Banks

Repo, Debt and Risk: The Fed's Untold Warning for 2026

When Losing Money Pays: America's Broken Market Logic

The Hidden Time Bomb in AI Finance
Technicals for EQT Corporation


Price Summary
With a 5.69% increase, EQT Corporation enjoyed a stellar day in the stock market.On 2026-07-22, EQT Corporation's stock opened at 51.1, spiked to 54.06, declined to 50.75, and closed 5.69% up at 54.01, with 17794788 shares traded.
Throughout the 52-week period, the stock hit a high of 67.93 and a low of 48.85.
Technicals
Support and Resistance: The current price sits at 54.01, supported at 48.85 and capped by resistance at 56.41. These levels define a range for EQT where the price might stabilize, with 48.85 as a floor and 56.41 as a ceiling.
Aroon: The AROON indicator is currently reflecting a strong bullish trend, as the Aroon Up has risen and the Aroon Oscillator has reversed. These signals suggest a reversal to an upward trend, indicating that market sentiment is shifting towards optimism. Investors might expect further upward momentum, with the potential for continued gains in the market.

Bol. Bands: The current reading of the BOLL BANDS is neutral, offering no clear signals for a movement in either direction. This suggests that the market may be in a holding pattern, with no dominant trend in place.

Parabolic SAR: The PSAR has recently reversed from bearish to bullish, suggesting a possible upward trend. If this move is confirmed by other indicators, it could indicate a strong bullish signal. Investors may want to consider this as a potential opportunity, especially if additional trends support the PSAR's new direction.

Stochastic: The current state of the STOCHASTIC is neutral, offering no clear signals of movement in either direction. This suggests a potential pause in market activity, with no strong trend emerging at the moment.

Tripple Moving Agerage: A bullish trend is evident from the alignment of the 20-50-100 period moving averages, but the slopes of the faster averages indicate a potential reversal for EQT. The weakening signals from the shorter-term averages suggest that the upward momentum may be fading, signaling the possibility of an impending change in trend.

When evaluating a company's technical data, such as stock price charts or volume, it is essential to first consider its fundamentals. These fundamentals include financial stability, growth potential, and competitive advantages. Additionally, understanding the broader industry in which the company operates offers context that helps to make sense of technical patterns. By examining both the company's internal strengths and external environment, one can make more accurate and meaningful conclusions about its stock performance.
If you have enjoyed reading, spread the word:
Good prospects:
Companies with the best and the worst technicals.
Latest Regulatory Filings for SP5
Companies with the best and the worst fundamentals.
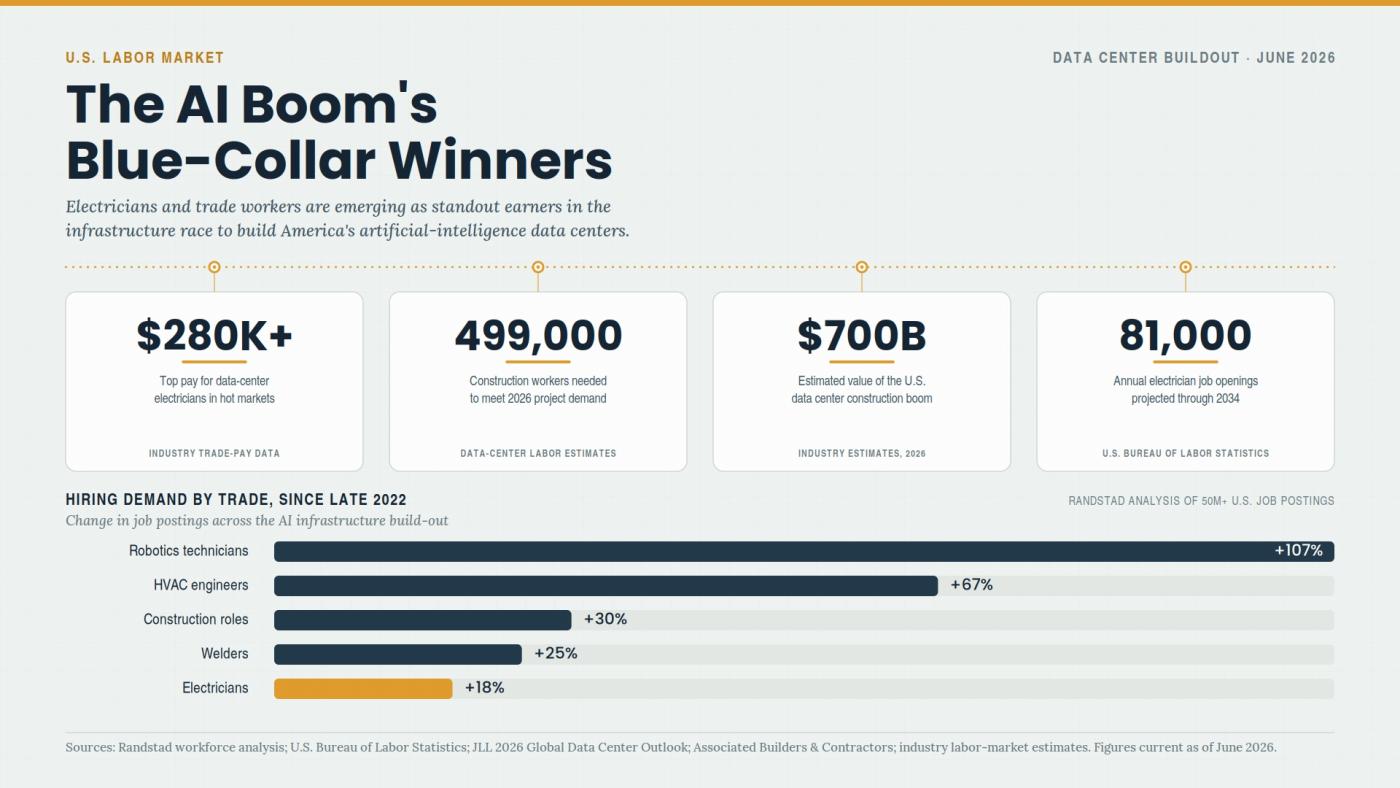
Why Electricians Now Out-Earn Software Engineers
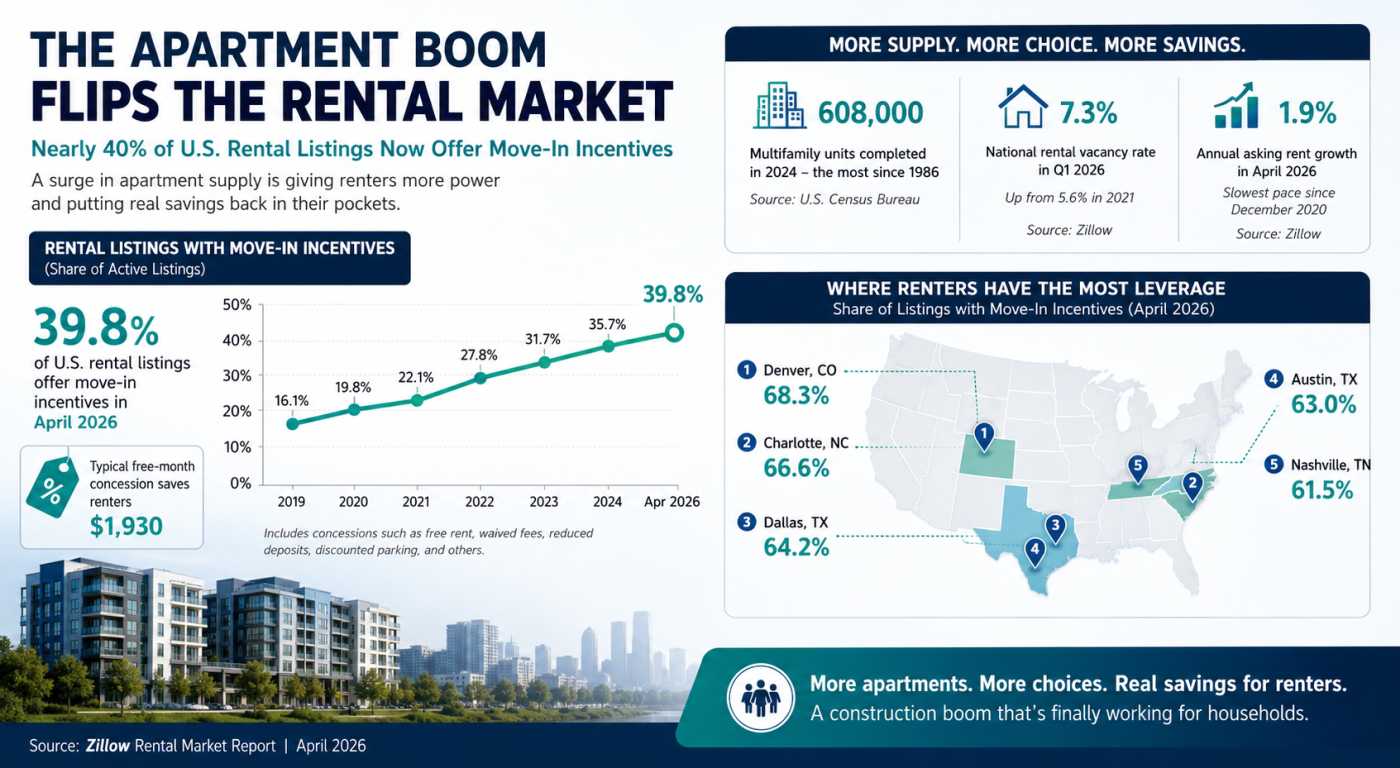
The Apartment Glut Changing America’s Rental Market

Why Community Colleges Are Winning Again
