More about EOG Resources, Inc.
Regulatory Filings for EOG Resources, Inc.
Fundamentals for EOG Resources, Inc.

The Machines That Ate the Grid: Five Centuries of Power Hunger
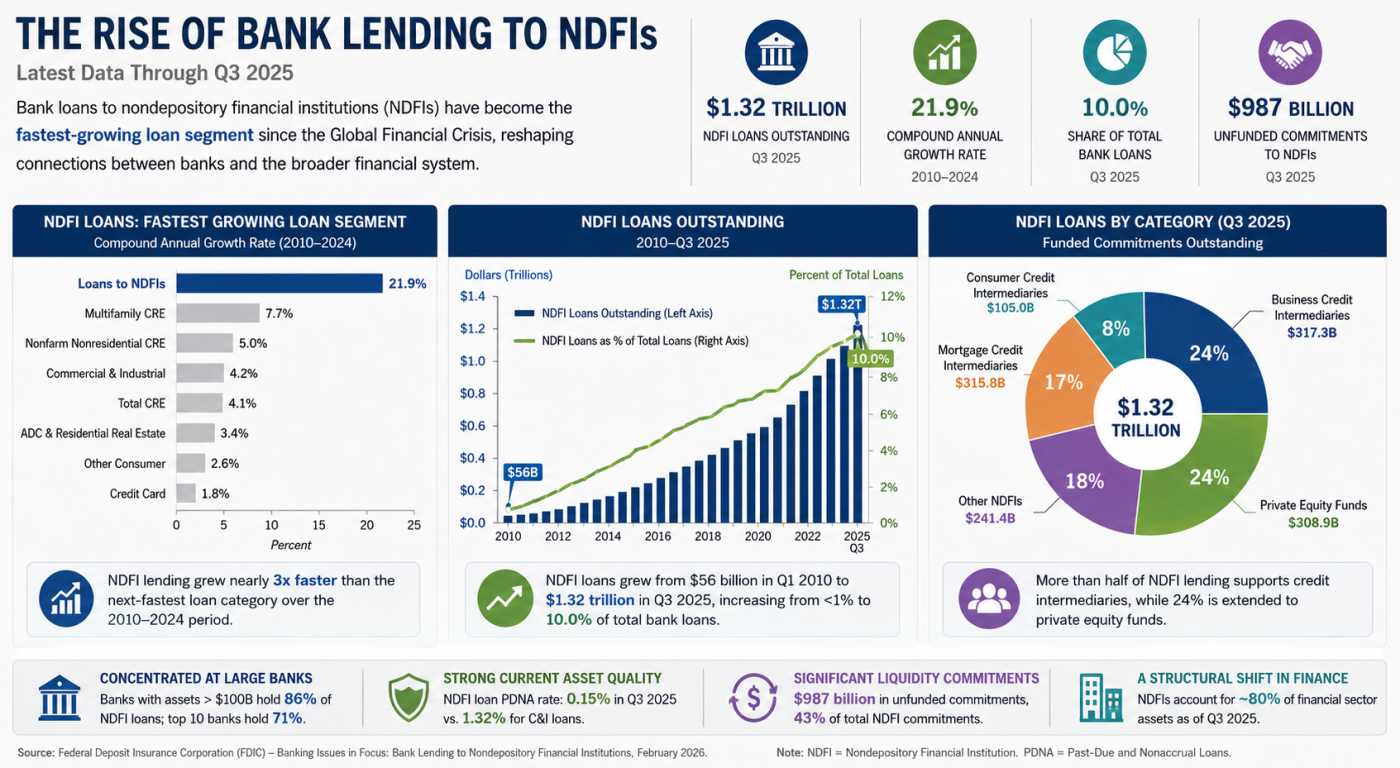
Private Credit’s Secret Banking Backbone Is Growing Faster Than Anyone Expected

America's $5 Trillion Business Handoff Has Already Begun

The Repair Economy Boom in Rural America
Technicals for EOG Resources, Inc.


Price Summary
On 2026-05-08, EOG Resources, Inc.'s stock began at 130.53, climbed to 131.56, dropped to 129.2, and had -0.38% to end at 130.03, with a volume of 3590833 shares.Over the past 52 weeks, the stock reached a maximum price of 149.89 and a minimum price of 101.78.
Technicals
Support and Resistance: With the current price at 130.03, support is found at 127.89 and resistance at 134.51. These levels indicate where buyers might step in at 127.89, while sellers could limit gains at 134.51, defining a trading boundary for EOG Resources, Inc..
Aroon: The AROON is currently in a neutral position, offering no clear indication of movement up or down. This suggests that the market may be experiencing a period of equilibrium, with no strong trend in play.

Bol. Bands: The BOLL BANDS is in a neutral stance for EOG, not indicating a clear upward or downward trend. This suggests a period of market indecision, where neither bulls nor bears have the upper hand.

Parabolic SAR: The PSAR maintains its bearish outlook, setting a resistance level that could act as a ceiling for upward momentum. This ongoing bearish trend suggests that the market may struggle to overcome this resistance, keeping prices subdued.

Stochastic: The STOCHASTIC is showing a neutral stance, with no definitive indication of an upward or downward trend for EOG. This neutral position suggests a period of indecision in the market, making it difficult to predict the next move.

Tripple Moving Agerage: The current state of the Tripple MOVING AVG is neutral for EOG, providing no clear indication of a trend in either direction. This suggests that the market may be lacking momentum, making it difficult to predict future movements.

A thorough analysis of a company involves looking beyond its stock price movements and trading patterns. You must also examine its fundamentals, which include profitability, growth prospects, and competitive advantages. Additionally, the industry in which the company operates provides important context, as factors like technological innovations, regulation, and market demand influence performance. By integrating this information with technical analysis, more accurate predictions about the company's future can be made.
DISCLAIMER: We provide information and our musings based on events, but nothing on this site can be considered professional advice of any kind.
If you have enjoyed reading, spread the word:
Good prospects:
Companies with the best and the worst technicals.
Latest Regulatory Filings for SP5
Companies with the best and the worst fundamentals.

Debt, Deficits & Disaster: The Bond Market Crisis

Not Wall Street, But AI: The Real Force Democratizing Finance Across America

When Flooding Pays: A New Financial Bet
