More about Elevance Health, Inc.
Regulatory Filings for Elevance Health, Inc.
Fundamentals for Elevance Health, Inc.
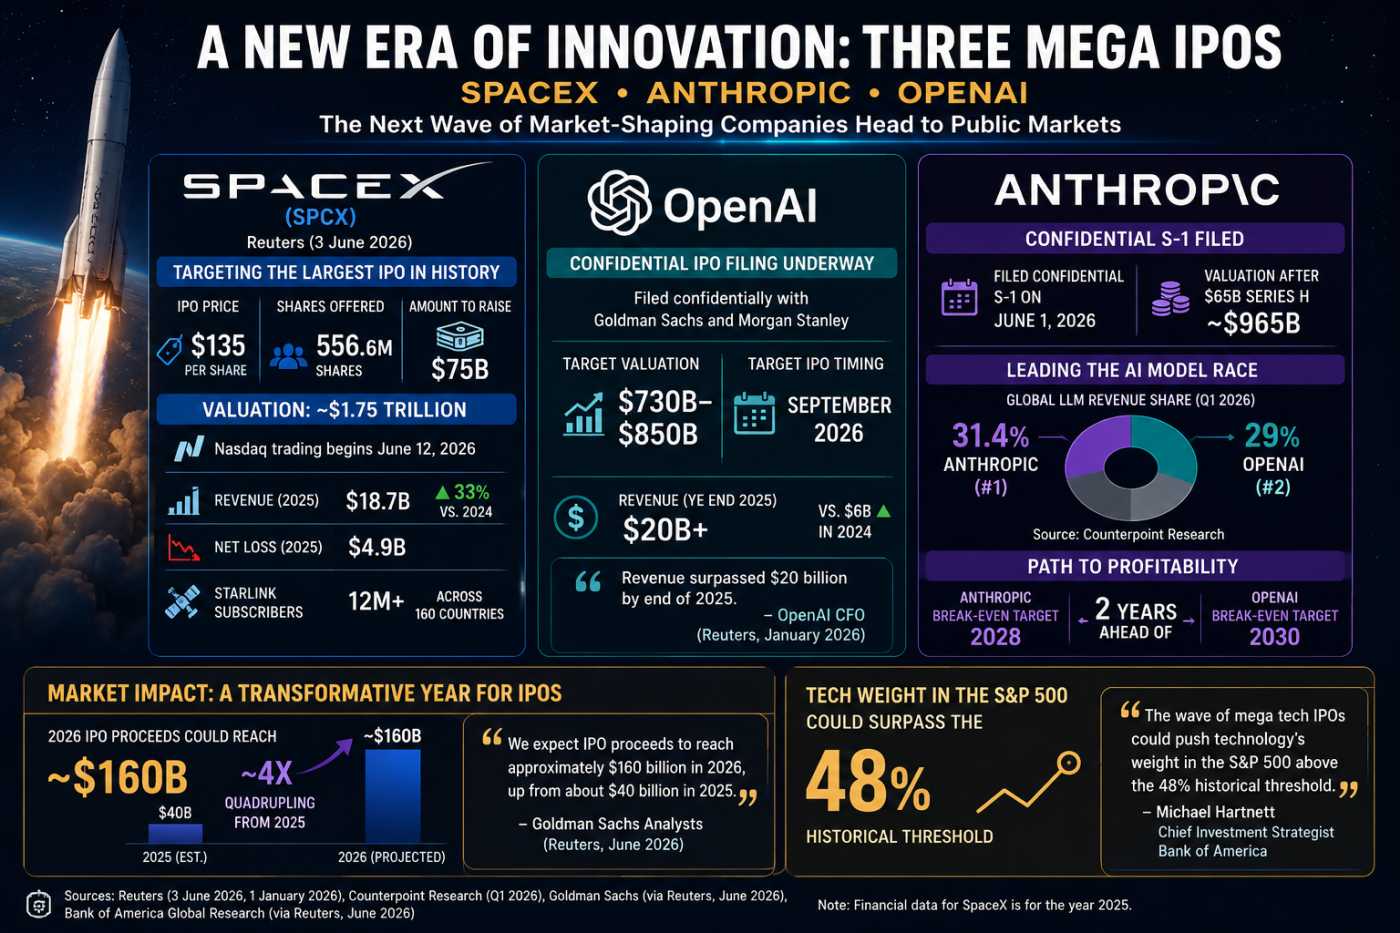
The Biggest IPO Year Ever: Can Markets Absorb It?
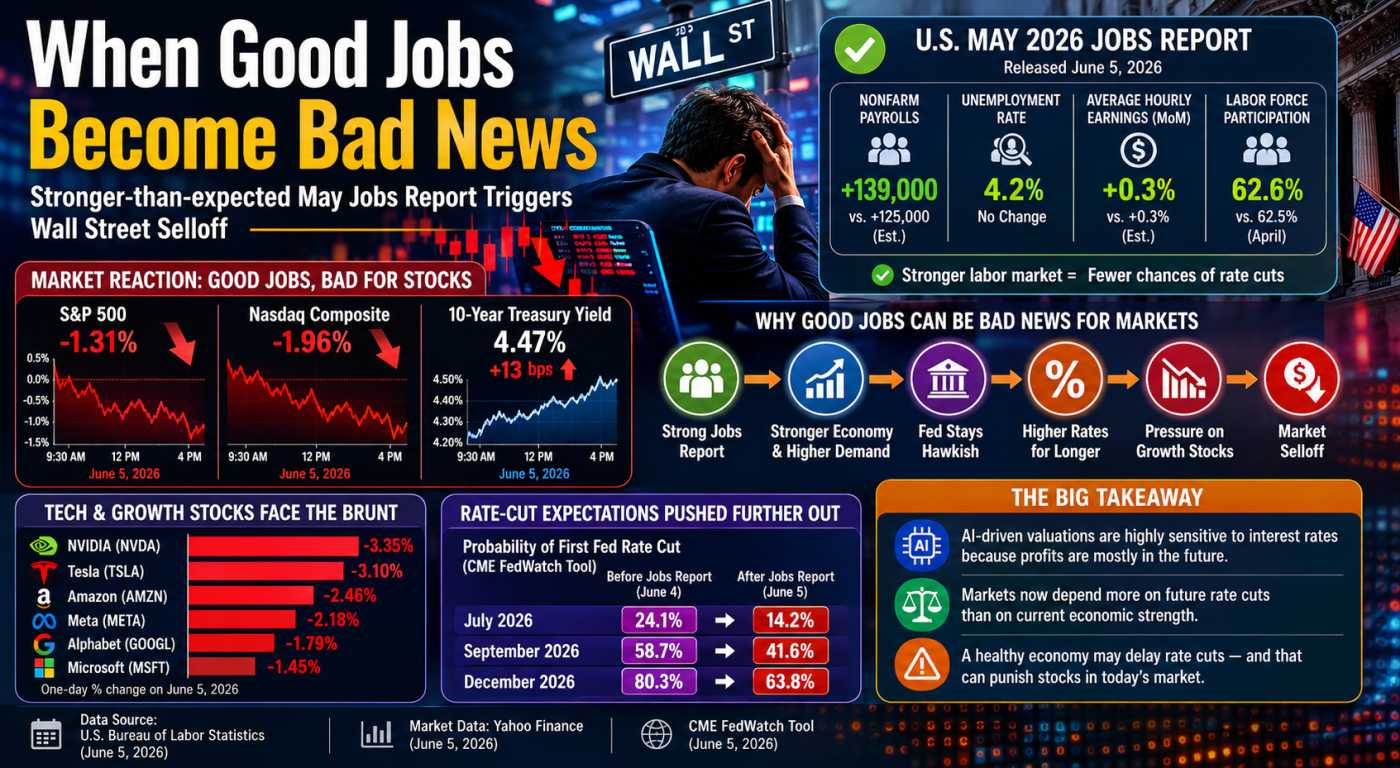
The Jobs Report That Crashed the Rally

The Fed Study Revealing Tomorrow's Investment Themes
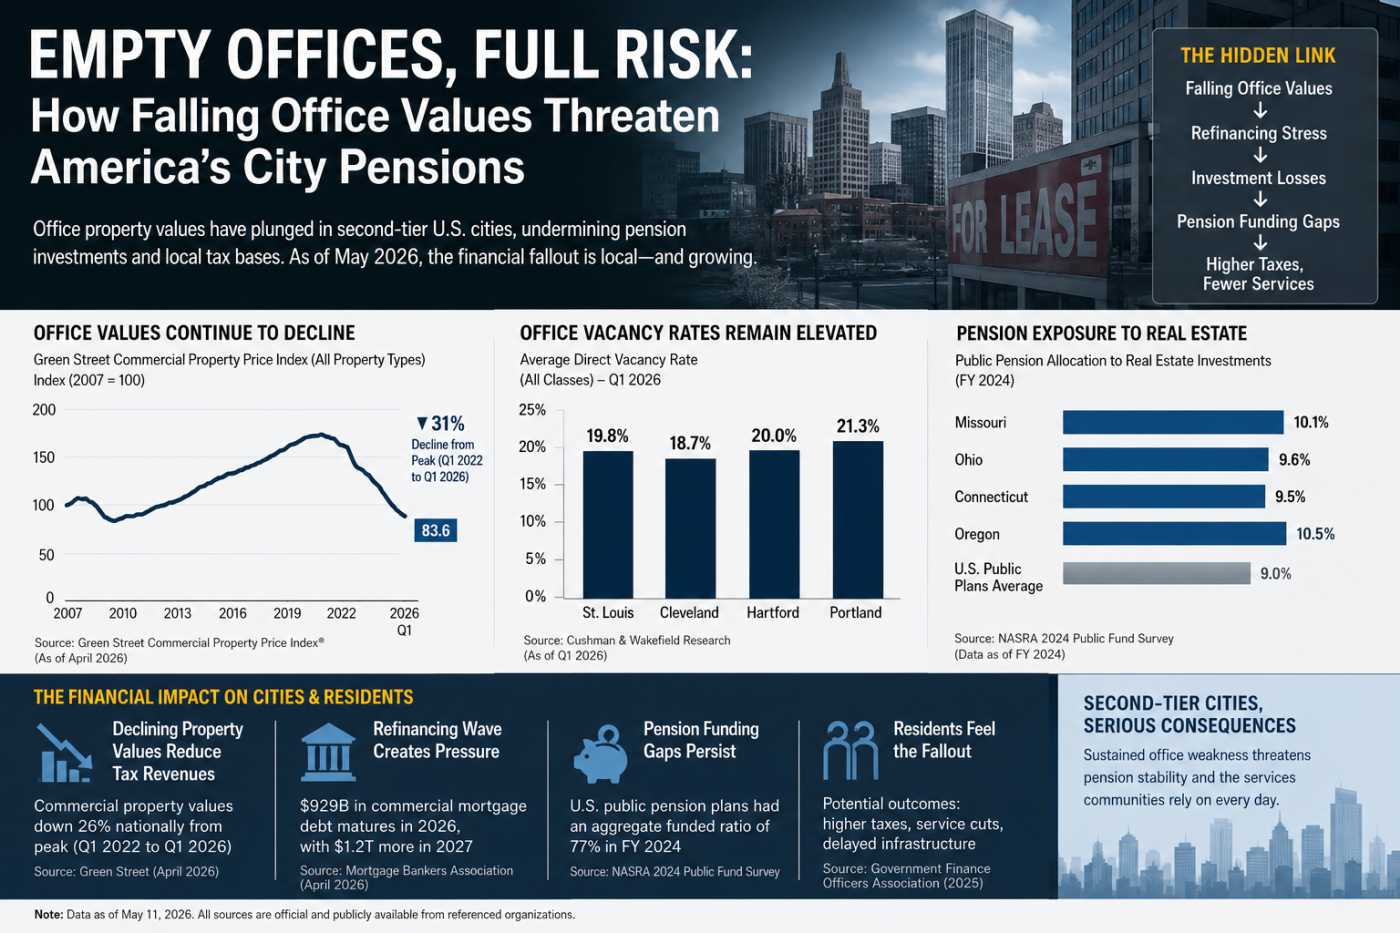
America’s Empty Offices Hit Pensions Hard
Technicals for Elevance Health, Inc.


Price Summary
Elevance Health, Inc.'s shares tumbled -4.81% today, reflecting a unimpressive day on the market.On 2026-06-10, Elevance Health, Inc.'s stock started at 425.0, soared to 426.79, dropped to 401.64, and finished the day -4.81% lower at 404.56, with a trading volume of 1881300 shares.
In the last 52 weeks, the stock's top price was 424.43 and the bottom price was 274.66.
Technicals
Aroon: The continuation of Aroon's bullish trend, with Aroon Up at the 100 level, signals ongoing strength. To fully understand the implications of this trend, it should be examined further in conjunction with other technical indicators.

Bol. Bands: The recent decline below the upper Bollinger Band could signal a potential downward trend. This movement might indicate that the asset is losing bullish momentum and is overbought, suggesting that a correction is due. Traders often interpret this as an early warning of a reversal, making it a crucial point for reevaluating trading strategies and positions.

Parabolic SAR: The PSAR for ELV continues to signal a bullish outlook, establishing a crucial support level that may help sustain the current upward momentum. This level of support suggests that the market is likely to continue trending higher, providing a foundation for ongoing bullish movement.

Stochastic: The STOCHASTIC is showing a neutral stance, not indicating a clear upward or downward trend for Elevance Health, Inc.. This suggests a period of market balance, where neither side is showing dominance.

Tripple Moving Agerage: The alignment of the 20, 50, and 100 moving averages suggests a bearish trend, but the wavering slopes of the 20 and 50 SMAs hint at a potential shift. This weakening momentum could indicate that the bearish trend is running out of steam, possibly leading to a bullish reversal in the near future. Investors should be aware of the possibility of a market turnaround as the current downtrend begins to falter.

A comprehensive approach to analyzing a company requires considering both its technical and fundamental aspects. The company's fundamentals, such as its earnings, growth prospects, and financial health, provide a strong foundation for understanding technical indicators. Additionally, examining the industry it operates in helps contextualize the company's position within the broader market. By integrating these factors, one can gain more valuable insights into the company's stock performance and potential investment opportunities.
If you have enjoyed reading, spread the word:
Good prospects:
Companies with the best and the worst technicals.
Latest Regulatory Filings for SP5
Companies with the best and the worst fundamentals.
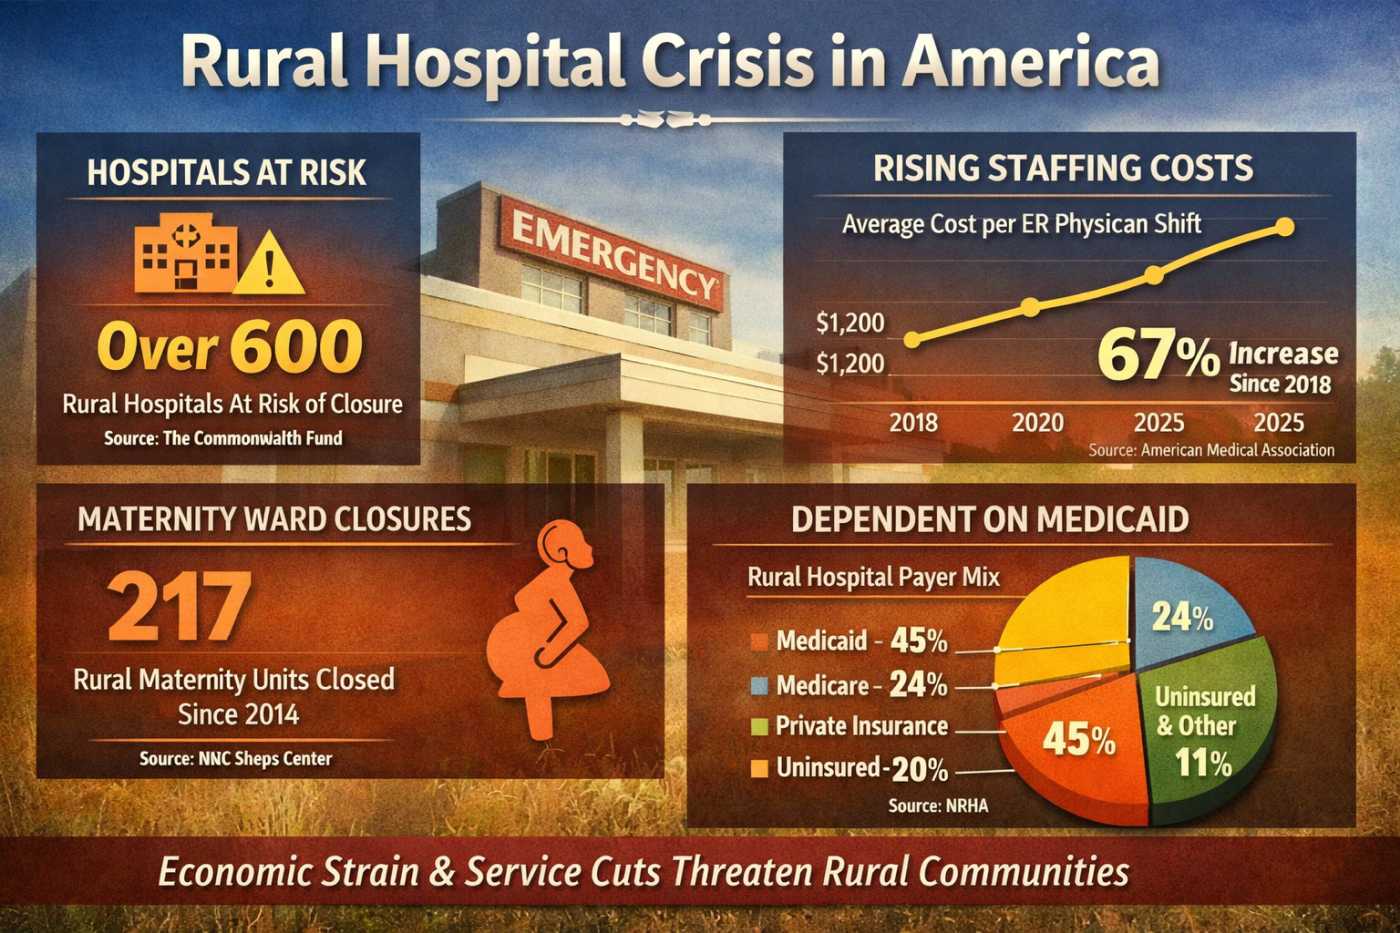
Rural Hospitals Buckle Under Private Equity
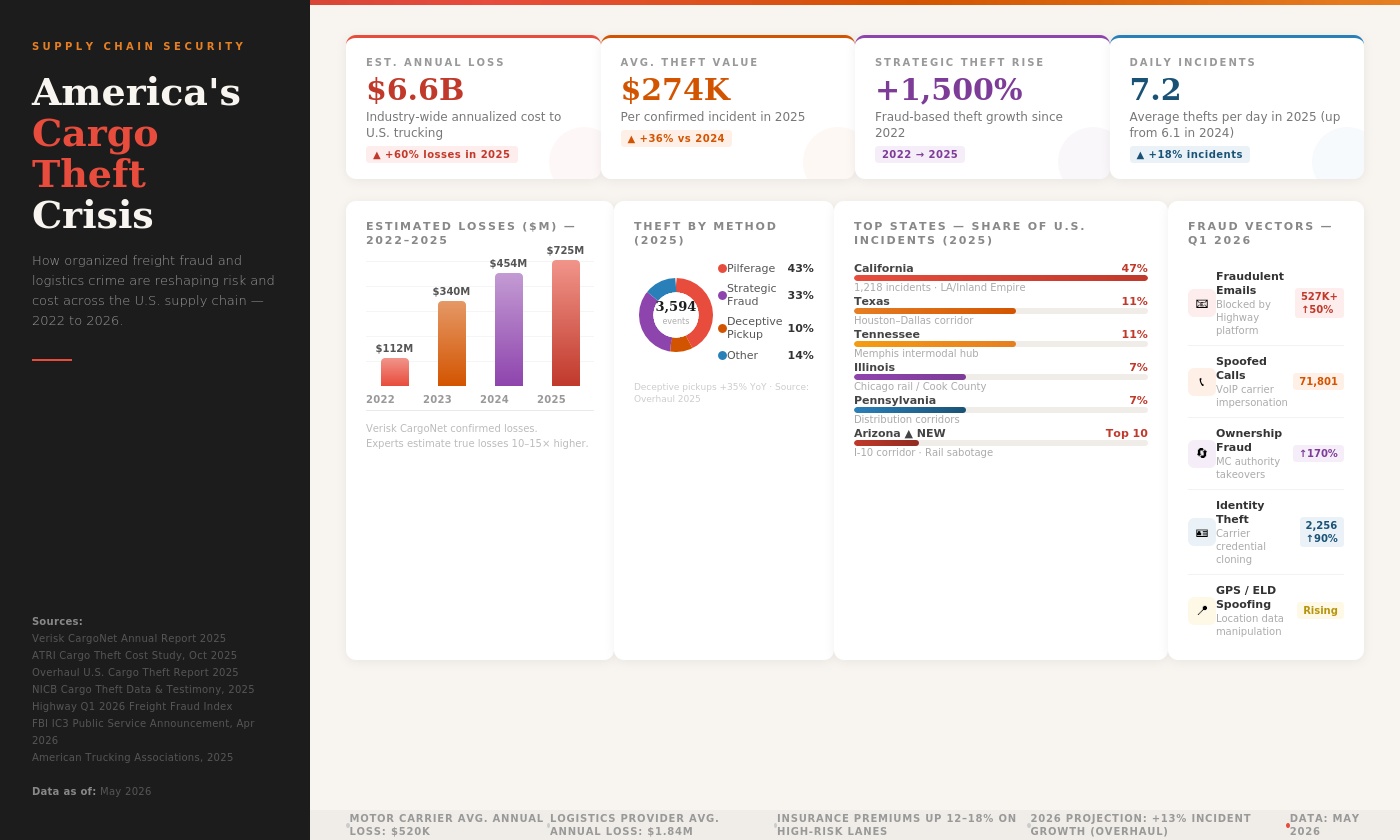
Fake Brokers, Spoofed GPS: Who Pays for Cargo Crime?
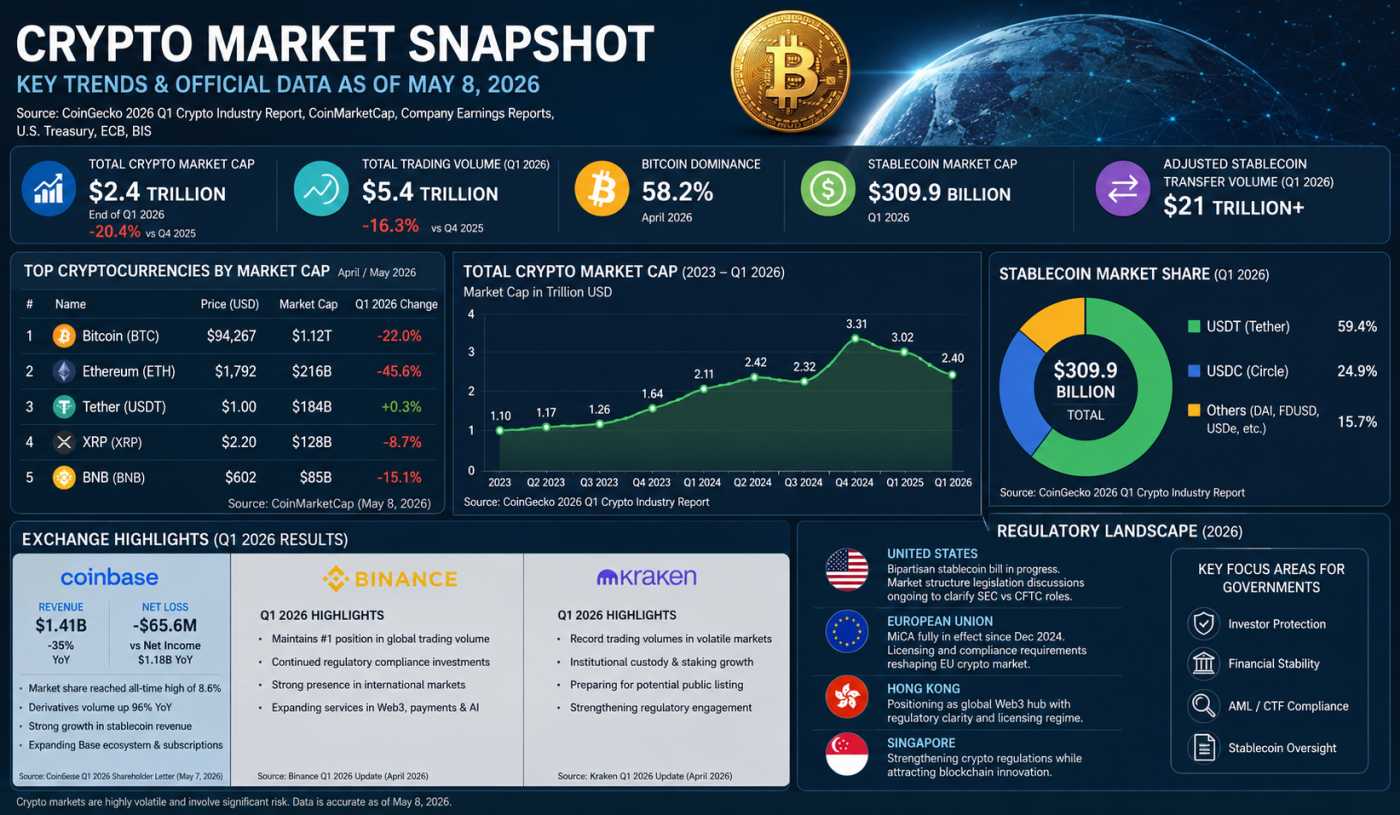
Crypto’s $2.4T Reality Check in 2026
