More about Electronic Arts Inc.
Regulatory Filings for Electronic Arts Inc.
Fundamentals for Electronic Arts Inc.

Diversification Shielded U.S. Banks

Repo, Debt and Risk: The Fed's Untold Warning for 2026

When Losing Money Pays: America's Broken Market Logic

The Hidden Time Bomb in AI Finance
Technicals for Electronic Arts Inc.


Price Summary
On 2026-07-22, Electronic Arts Inc.'s stock began at 209.01, peaked at 209.06, bottomed at 208.4, and closed -0.03% down at 208.95, with a volume of 2793438 shares.The highest price the stock achieved in the past 52 weeks is 209.29, while the lowest price it saw is 147.79.
Technicals
Support and Resistance: The price for EA at 208.95 finds support at 207.27 and resistance at 207.27. This suggests a trading range, where 207.27 serves as a support level and 207.27 acts as a resistance point, potentially capping further gains.
Aroon: The AROON is currently neutral, showing no clear bias toward a rising or falling trend. This lack of directional clarity suggests that the market may be in a holding pattern, awaiting further developments.

Bol. Bands: The BOLL BANDS is showing a neutral stance, with no definitive indication of an upward or downward trend for EA. This neutral position suggests a period of indecision in the market, making it difficult to predict the next move.

Parabolic SAR: The PSAR maintains its bullish stance, setting a significant support level that could help sustain the market's upward movement. This strong support suggests that Electronic Arts Inc. is likely to continue trending higher, providing investors with confidence in the ongoing bullish momentum.

Stochastic: The K-line for EA has dipped below the D-line on the stochastic indicator, while remaining above 80, suggesting that a bearish price move might be beginning. This pattern could indicate that the market's upward momentum is fading, possibly leading to a decline. Investors should keep an eye on this potential reversal.

Tripple Moving Agerage: The alignment of the 20, 50, and 100 moving averages suggests a bearish trend, but the wavering slopes of the 20 and 50 SMAs hint at a potential shift. This weakening of momentum could indicate that the bearish trend is running out of steam, possibly leading to a bullish reversal in the near future. Investors should be aware of the possibility of a market turnaround as the current downtrend weakens for Electronic Arts Inc..

To make the most of a company's technical analysis, it's important to start with an understanding of its fundamentals. These include profitability, cash flow, and competitive positioning. Additionally, the industry in which the company operates plays a critical role, as trends and external factors can influence its market performance. By considering both the company's internal fundamentals and the external industry environment, more meaningful and accurate conclusions can be drawn from the technical data.
If you have enjoyed reading, spread the word:
Good prospects:
Companies with the best and the worst technicals.
Latest Regulatory Filings for SP5
Companies with the best and the worst fundamentals.
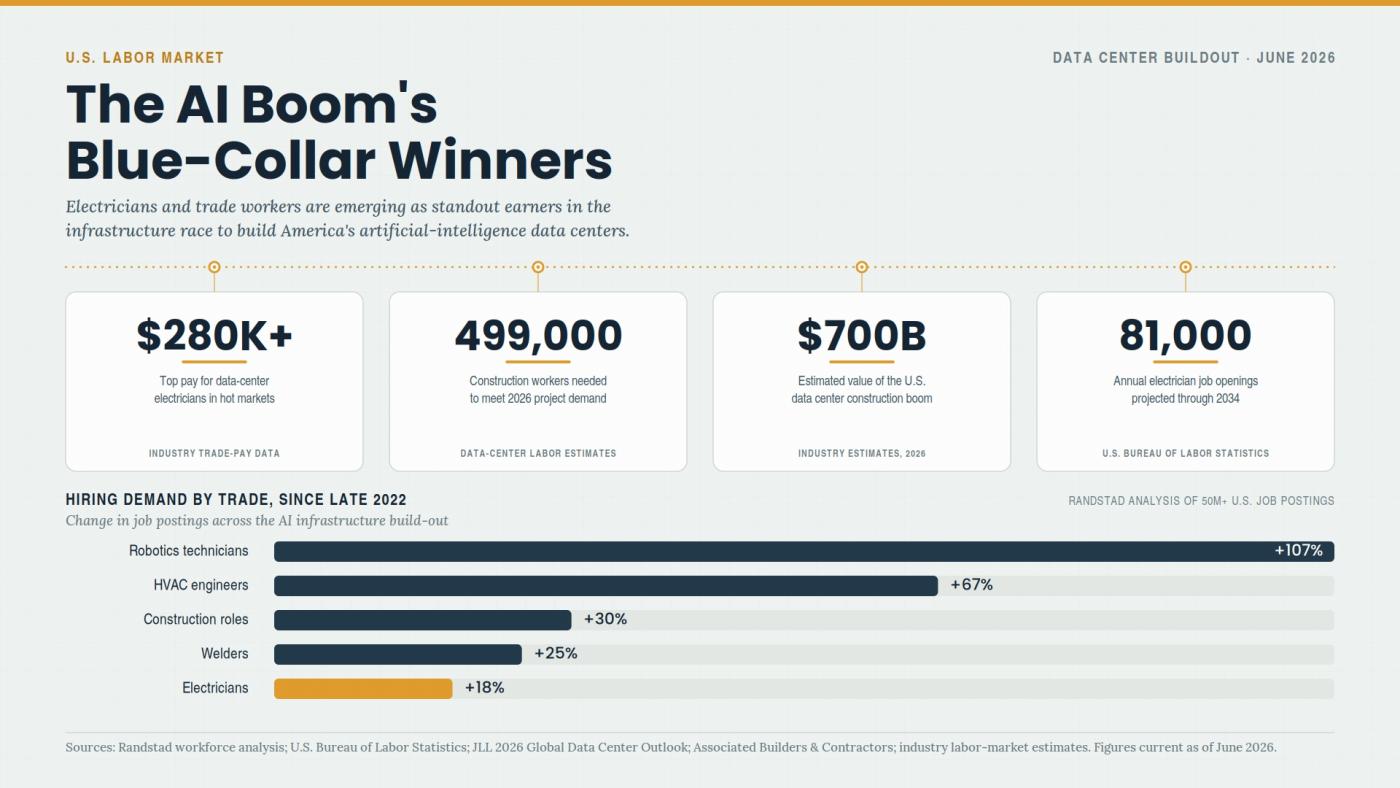
Why Electricians Now Out-Earn Software Engineers

The Apartment Glut Changing America’s Rental Market

Why Community Colleges Are Winning Again
