
More about Devon Energy Corporation
Regulatory Filings for Devon Energy Corporation
Fundamentals for Devon Energy Corporation

AI Learns to Read the Federal Reserve

AI Subscriptions Rewrite the Inflation Playbook

Diversification Shielded U.S. Banks

Repo, Debt and Risk: The Fed's Untold Warning for 2026
Technicals for Devon Energy Corporation



Price Summary
On 2026-08-20, Devon Energy Corporation's stock started at 49.02, soared to 49.72, dropped to 48.93, and finished the day 0.57% up at 49.3, with a trading volume of 10356700 shares.Over the previous 52 weeks, the stock reached a high of 52.07 and a low of 0.0.
Technicals
Support and Resistance: The current price is 49.3, with support at 48.79 and resistance at 51.52. This range suggests that the price might move between these levels, with 48.79 offering support and 51.52 capping further gains for Devon Energy Corporation.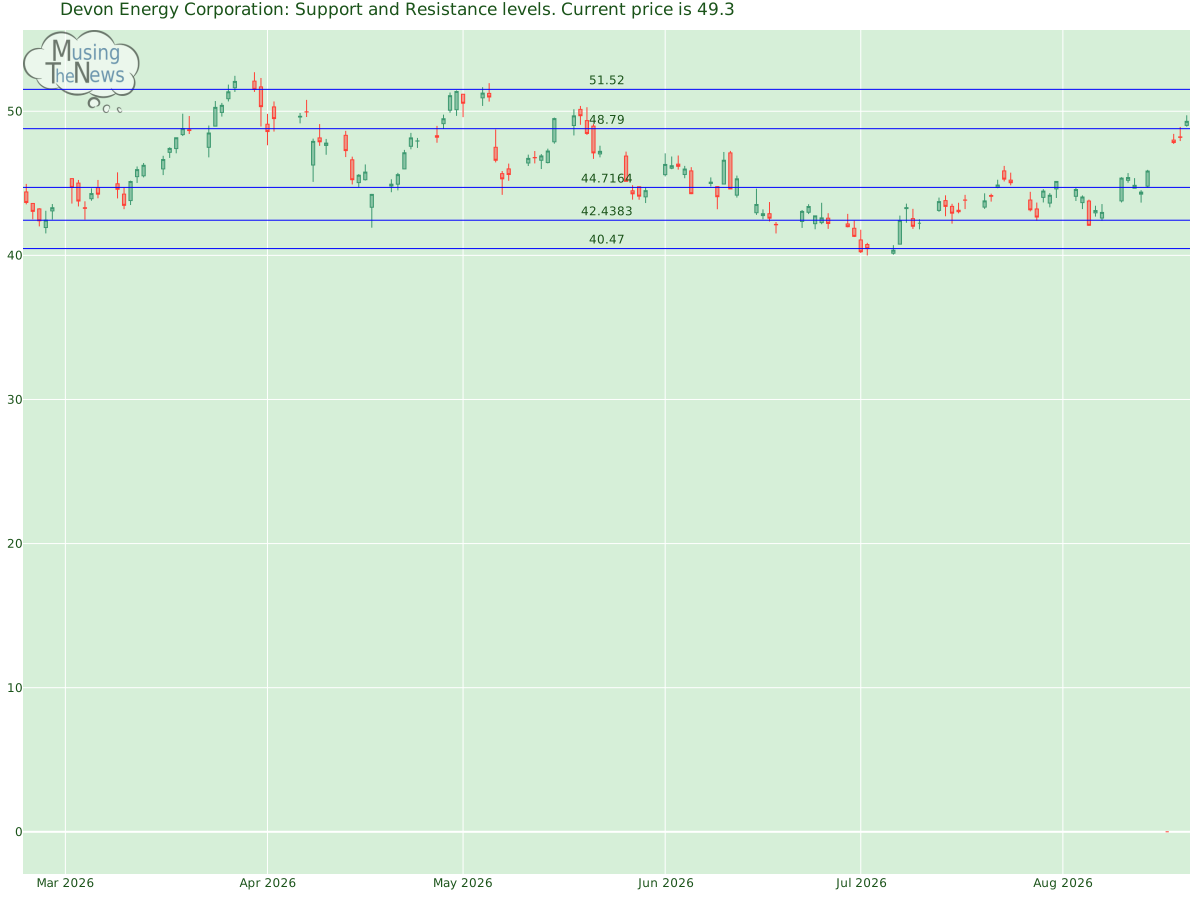
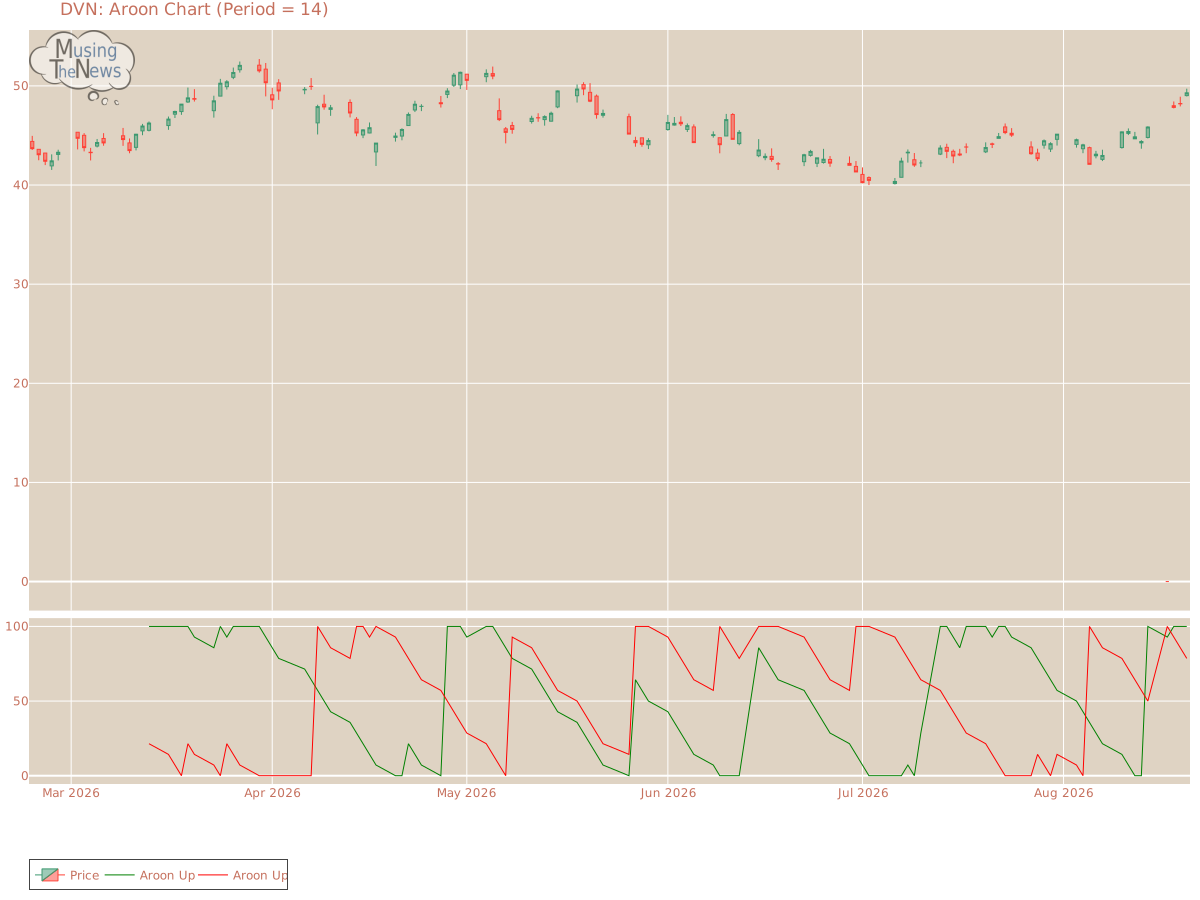
Aroon: The bullish trend in Aroon continues for DVN, with Aroon Up maintaining its position at the 100 level. This suggests sustained upward momentum, but further analysis is needed, especially in combination with other indicators, to confirm the trend's future prospects.
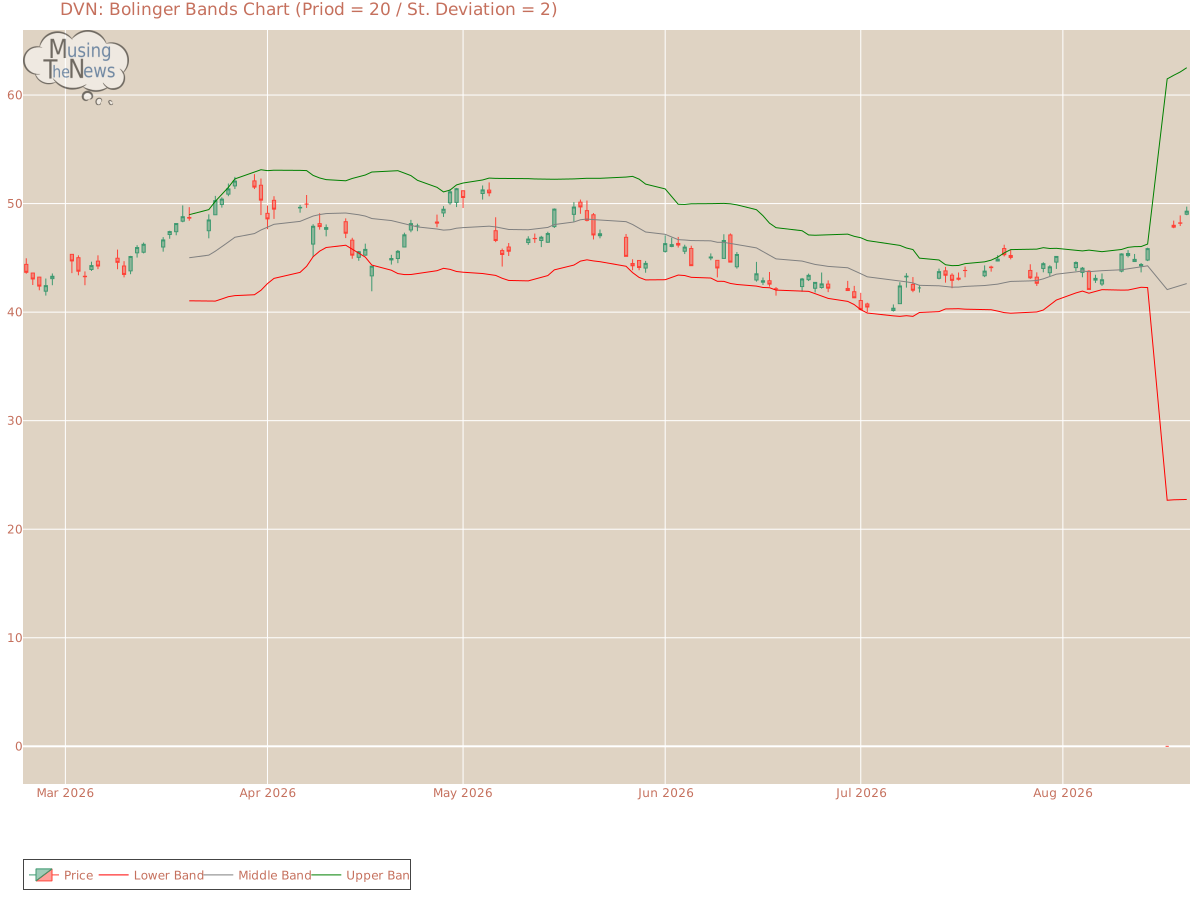
Bol. Bands: The BOLL BANDS is showing a neutral reading, with no clear direction indicated for upward or downward movement. This neutral position suggests a possible period of consolidation.
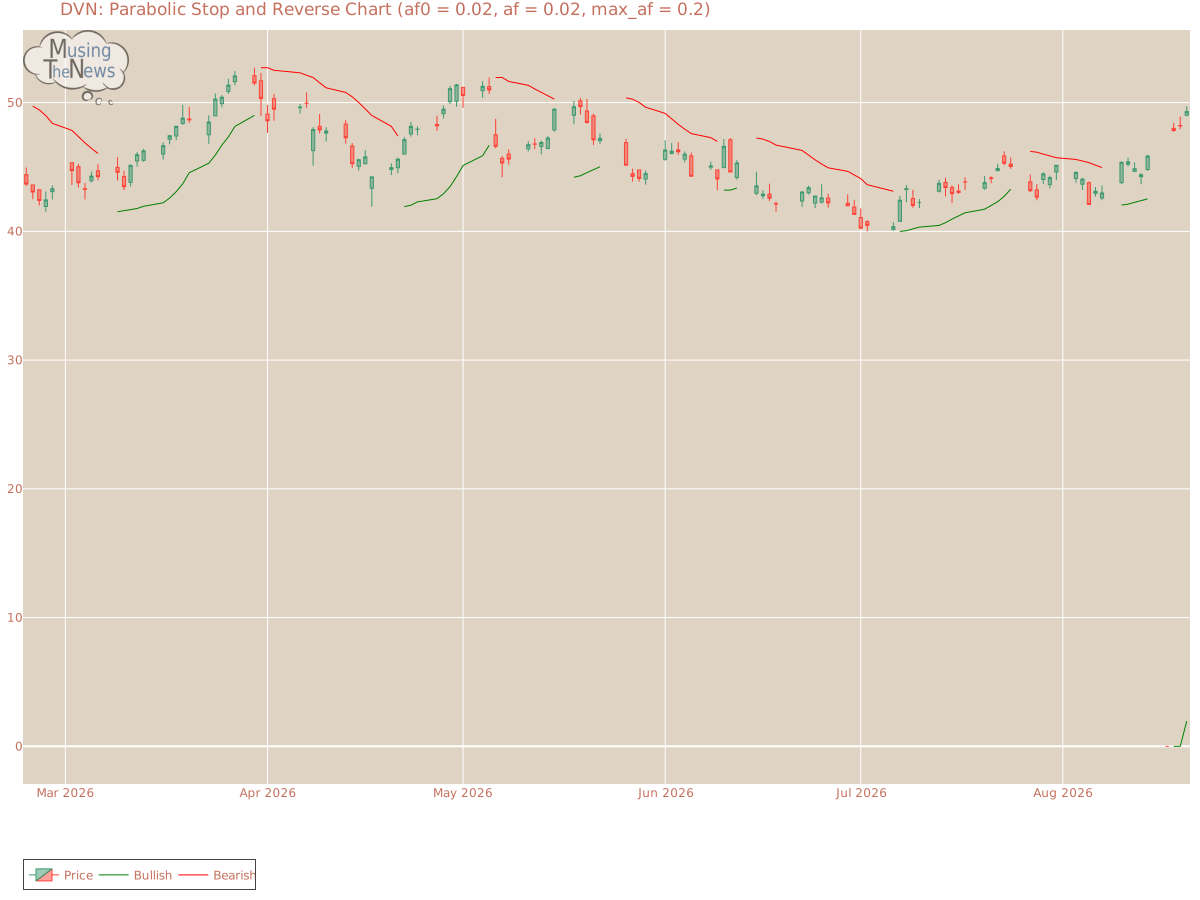
Parabolic SAR: The PSAR continues to indicate a bullish outlook, setting a crucial support level. This strong support could bolster the ongoing upward trend, suggesting that the market may remain in a positive trajectory. Investors may view this as a sign of sustained bullish momentum.
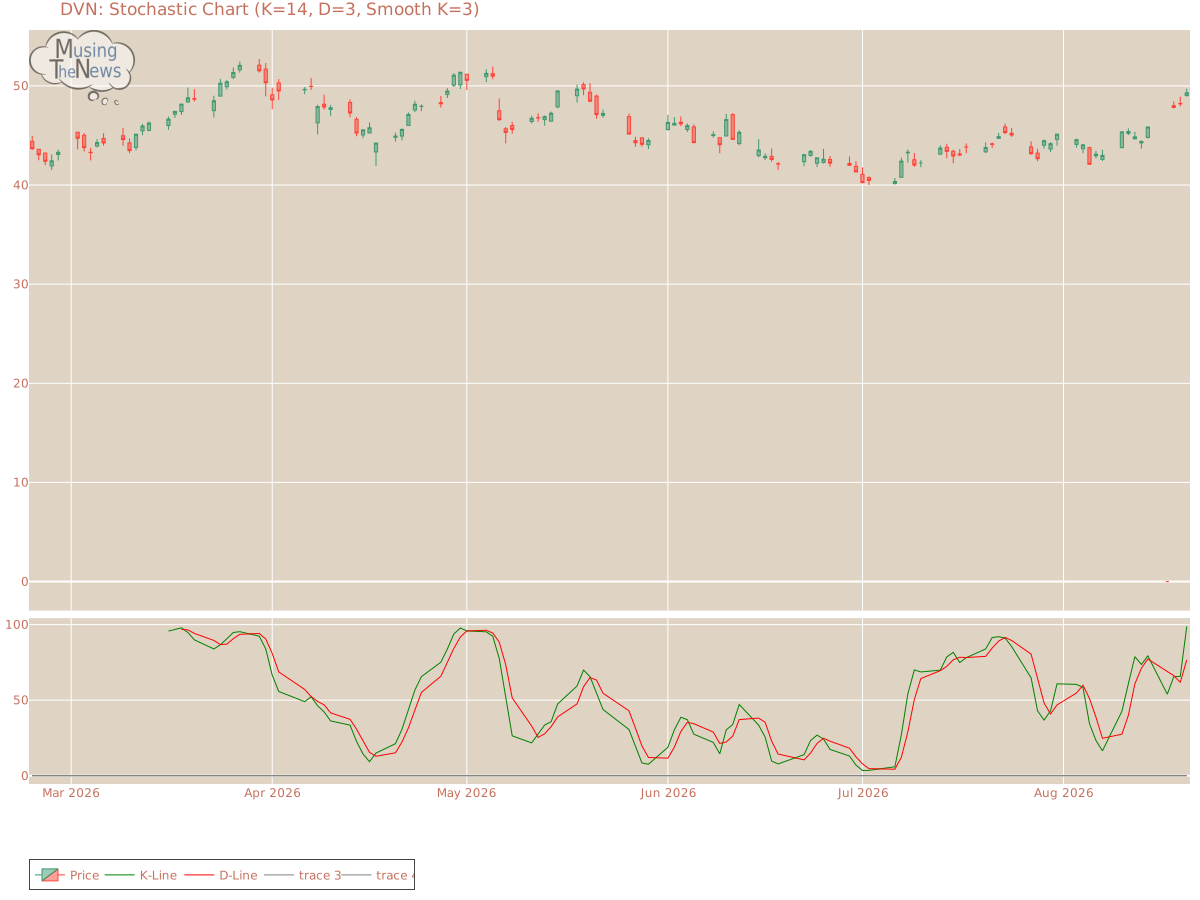
Stochastic: The stochastic indicator is currently bullish, with the K-line exceeding both the D-line and the 80 level. This configuration indicates robust upward momentum, suggesting that the market may experience further gains. Investors may interpret this as a positive signal for continued upward movement.
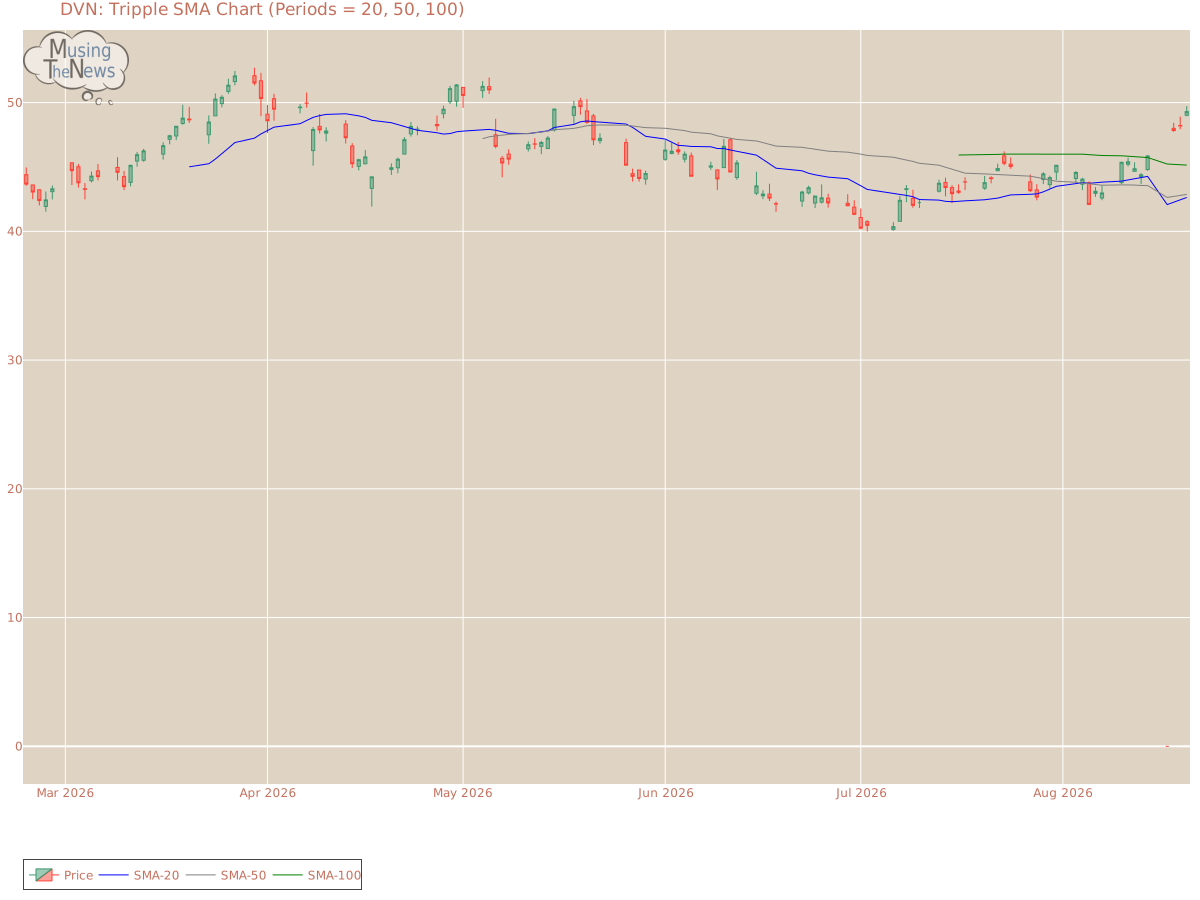
Tripple Moving Agerage: The Tripple MOVING AVG is in a neutral stance, with no clear signals for movement up or down. This neutral position indicates a potential period of consolidation or uncertainty in the market.
The technical analysis of a company's stock performance is valuable, but only when considered in conjunction with the company's fundamentals. These fundamentals, including financial strength, earnings growth, and leadership, provide a foundation for understanding market movements. Additionally, industry trends and competitive pressures play an important role. By integrating both fundamental and technical analysis, one can better evaluate the company's true potential and make more informed investment decisions.
If you have enjoyed reading, spread the word:
Good prospects:
Companies with the best and the worst technicals.
Latest Regulatory Filings for SP5
Companies with the best and the worst fundamentals.

When Losing Money Pays: America's Broken Market Logic

The Hidden Time Bomb in AI Finance
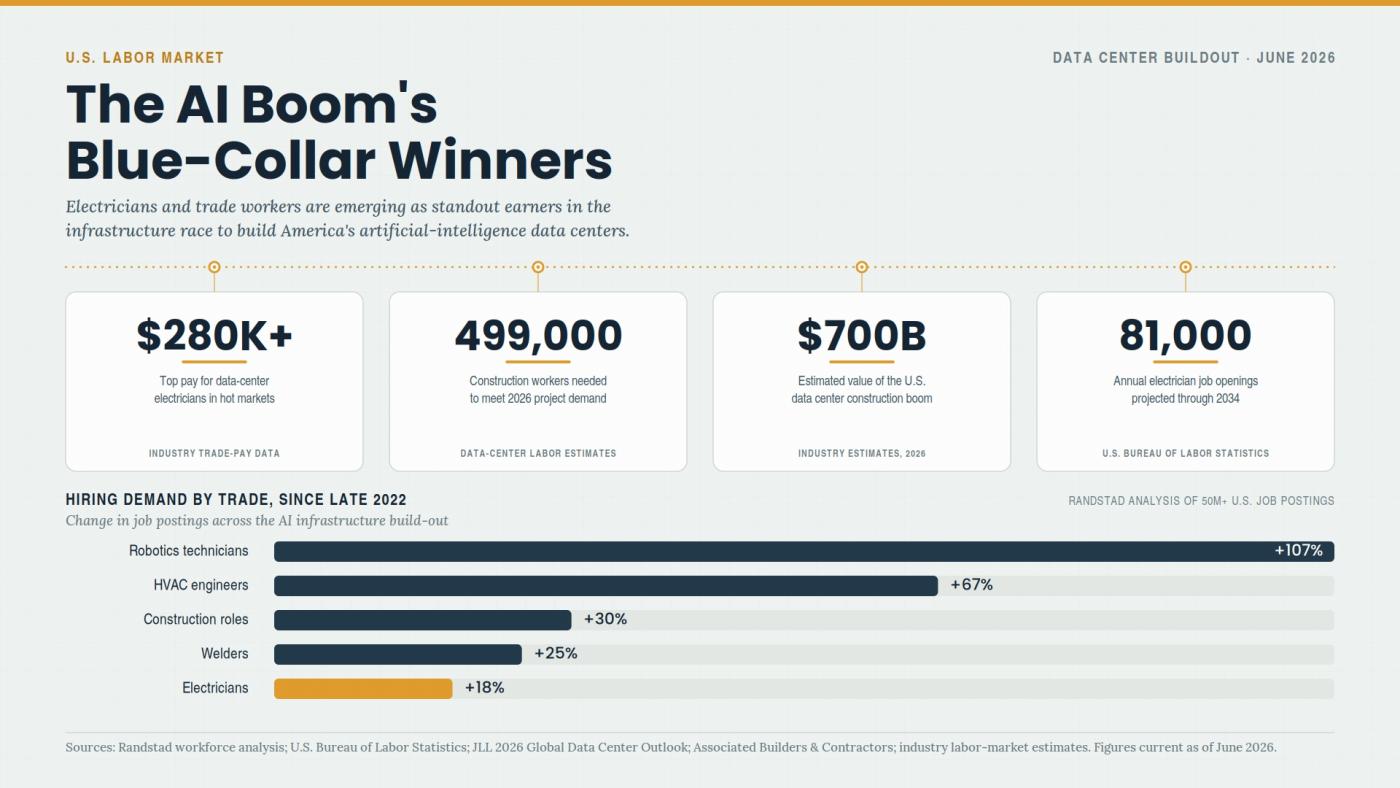
Why Electricians Now Out-Earn Software Engineers