More about Digital Realty Trust, Inc.
Regulatory Filings for Digital Realty Trust, Inc.
Fundamentals for Digital Realty Trust, Inc.
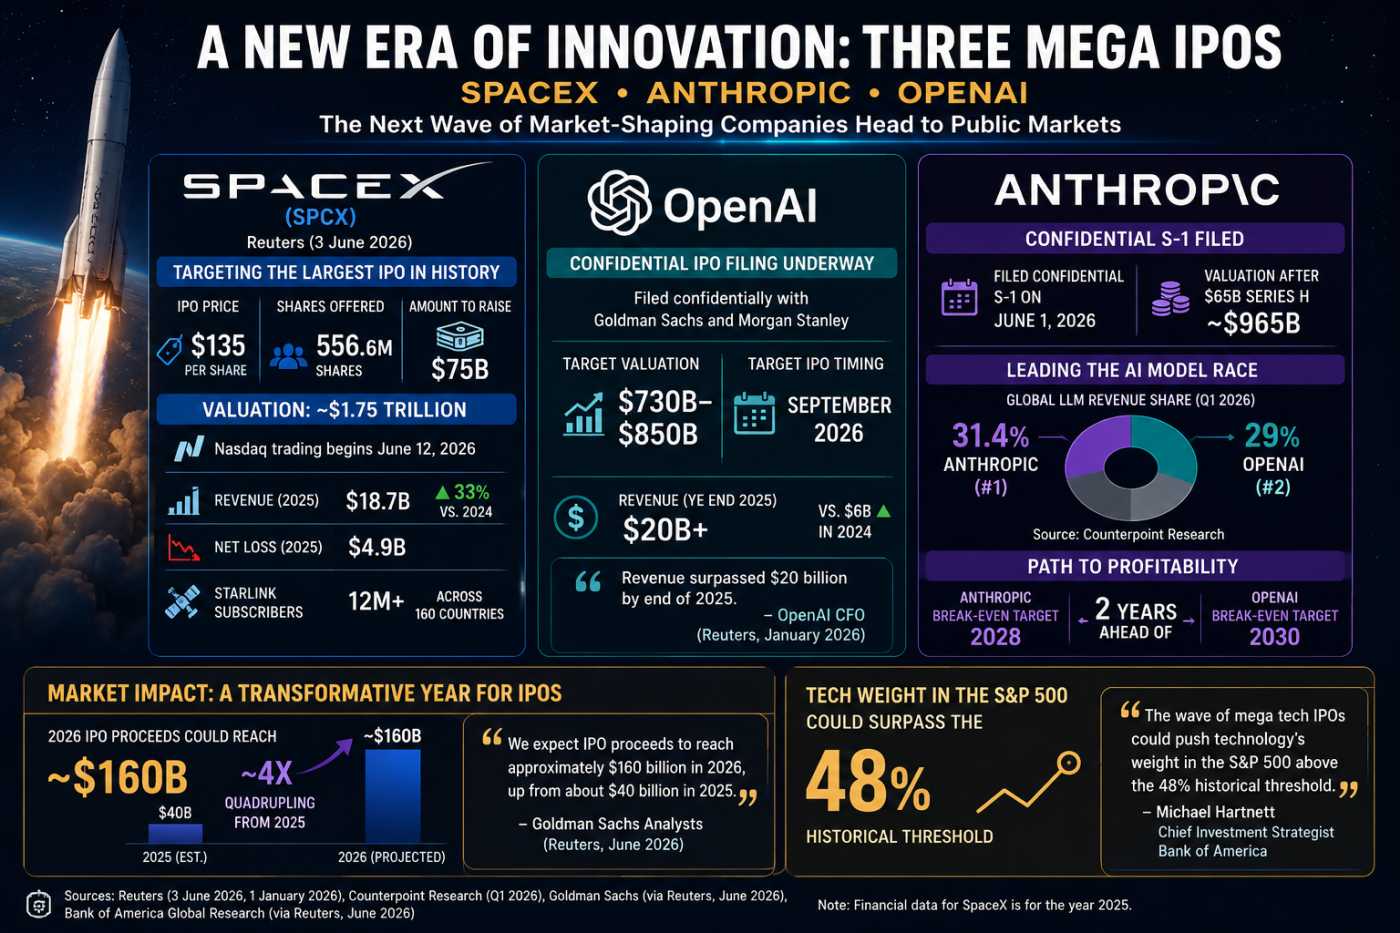
The Biggest IPO Year Ever: Can Markets Absorb It?
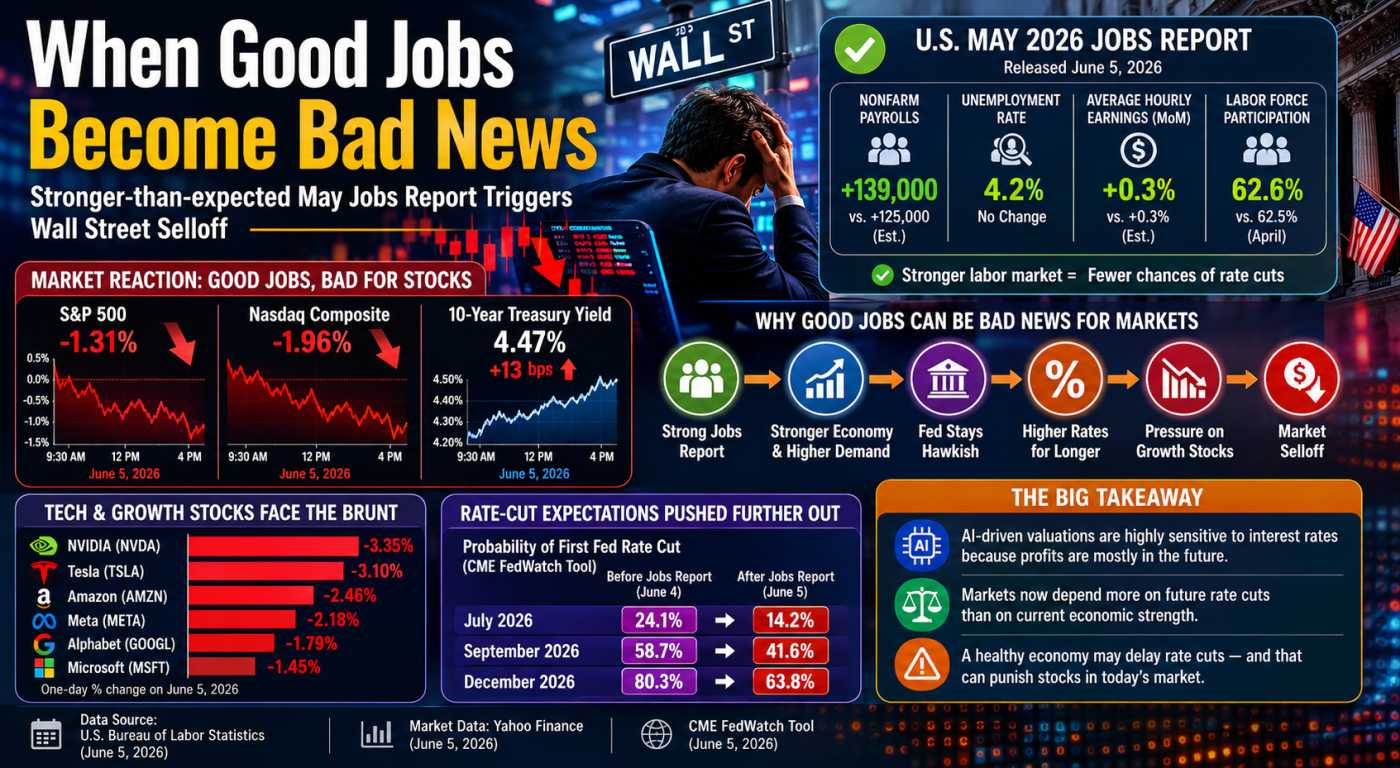
The Jobs Report That Crashed the Rally

The Fed Study Revealing Tomorrow's Investment Themes
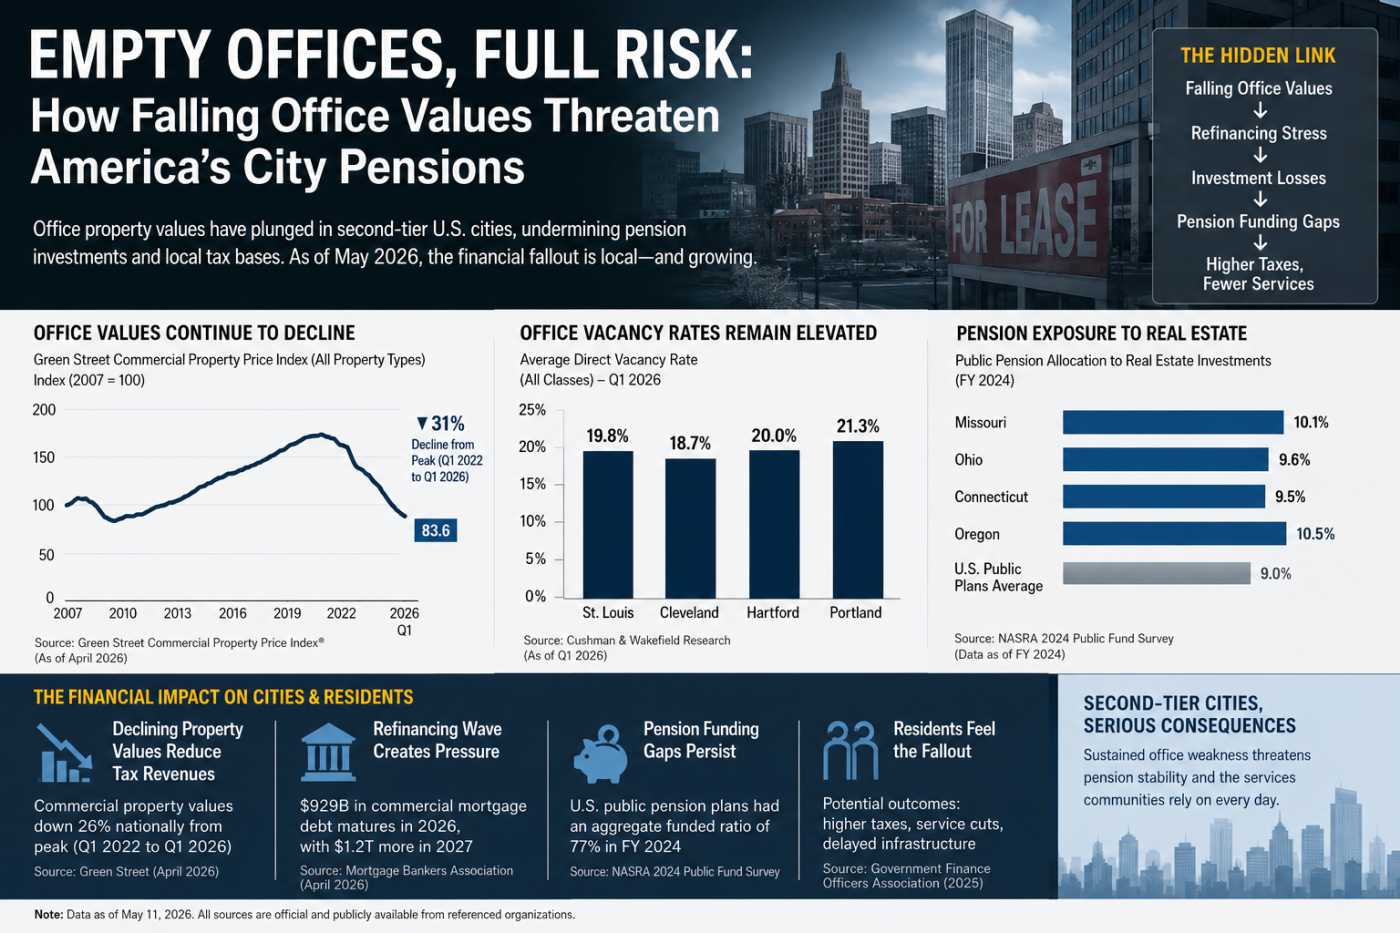
America’s Empty Offices Hit Pensions Hard
Technicals for Digital Realty Trust, Inc.


Price Summary
On 2026-06-10, Digital Realty Trust, Inc.'s stock opened at 184.24, reached a high of 184.99, dropped to a low of 180.75, and closed down -1.88% at 180.78, with a trading volume of 1733170 shares.The stock's peak price over the last 52 weeks is 203.91, with the lowest being 147.93.
Technicals
Support and Resistance: The current price sits at 180.78, supported at 177.48 and capped by resistance at 188.5. These levels define a range for DLR where the price might stabilize, with 177.48 as a floor and 188.5 as a ceiling.
Aroon: Aroon's bearish trend continues, with Aroon Down remaining fixed at the 100 level. This indicates strong downward momentum for DLR, but further analysis with other indicators is essential to fully comprehend the trend's potential impact.

Bol. Bands: The price has recently crossed below the lower Bollinger Band, suggesting that the market might be in an oversold condition. This downward movement indicates intensified selling pressure, pushing prices to a critical low. While this breach could signal a continuation of the bearish trend, it might also indicate a potential reversal if the market finds support at these lower levels.

Parabolic SAR: The PSAR maintains a bearish outlook for DLR, establishing a key resistance level that could limit further gains. This ongoing bearish trend suggests that the market may struggle to overcome this resistance, keeping upward movement subdued.

Stochastic: The Stochastic K-line has moved below both the D-line and the 20 level, reflecting a mildly bearish signal for DLR. This suggests that the market might encounter some downward pressure, but the overall bearish tone is moderate. Traders should remain observant for any further indications of a downturn.

Tripple Moving Agerage: The Tripple MOVING AVG is currently neutral, showing no clear bias toward a rising or falling trend. This lack of directional clarity suggests that the market may be in a holding pattern, awaiting further developments.

A company's technical data, including stock price and trading volume, can provide valuable insights when considered alongside its fundamentals. These include financial performance, market share, and growth strategy, as well as broader industry dynamics. Examining these factors helps investors or analysts make more informed decisions, as the company's fundamentals offer context for understanding how and why certain technical patterns may emerge in the market.
If you have enjoyed reading, spread the word:
Good prospects:
Companies with the best and the worst technicals.
Latest Regulatory Filings for SP5
Companies with the best and the worst fundamentals.

Rural Hospitals Buckle Under Private Equity
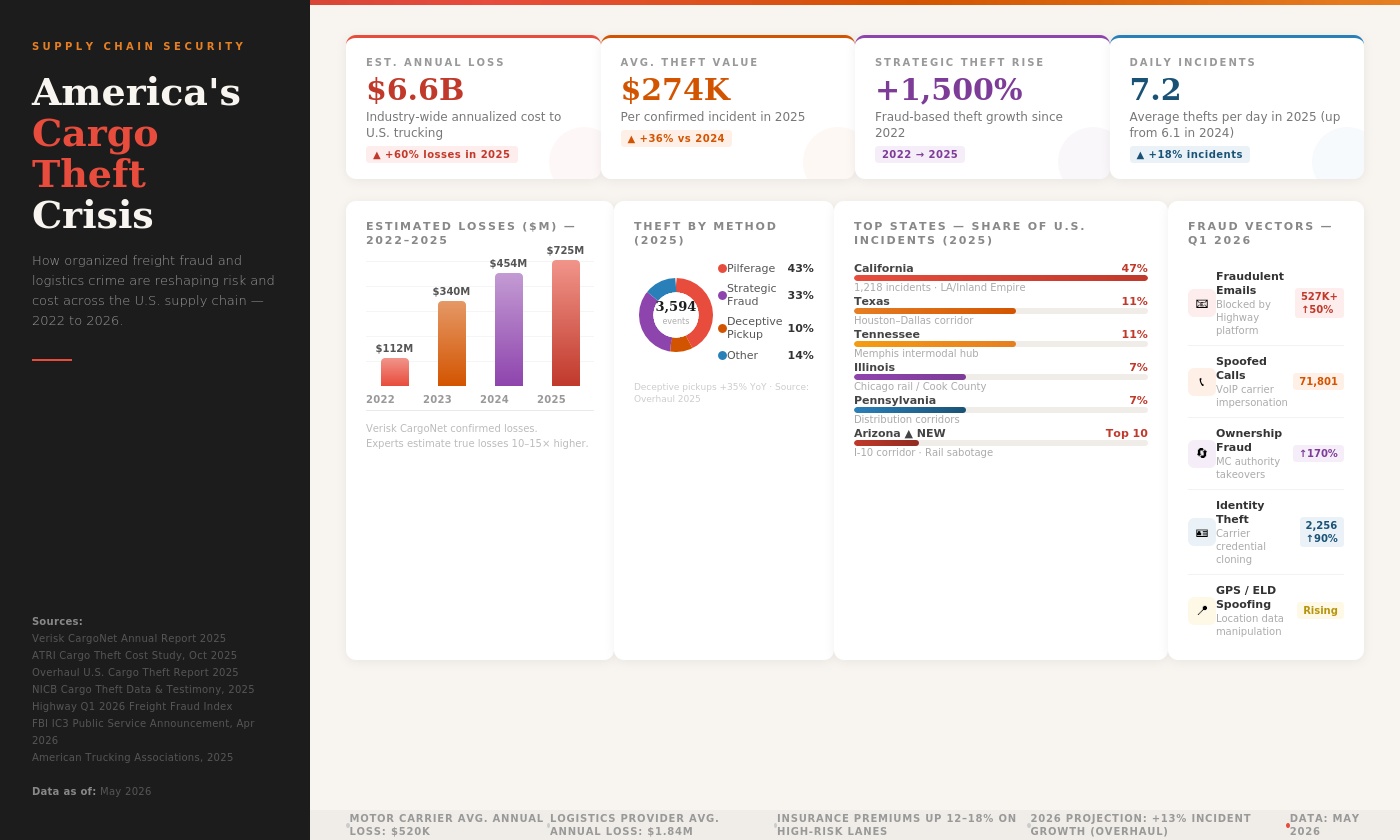
Fake Brokers, Spoofed GPS: Who Pays for Cargo Crime?
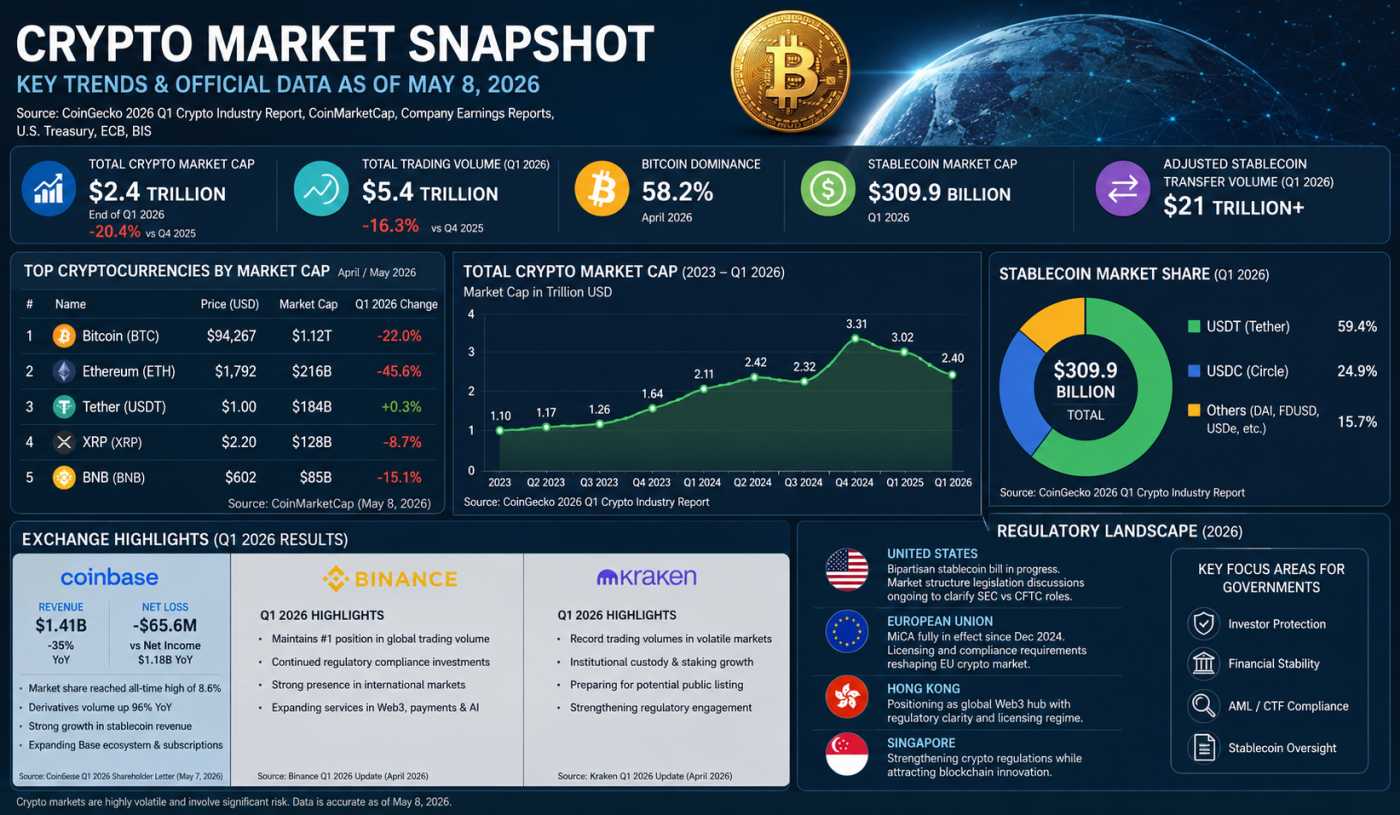
Crypto’s $2.4T Reality Check in 2026
