
Diversification Shielded U.S. Banks

Repo, Debt and Risk: The Fed's Untold Warning for 2026

When Losing Money Pays: America's Broken Market Logic

The Hidden Time Bomb in AI Finance
Technicals for CME Group Inc.


Price Summary
On 2026-07-22, CME Group Inc.'s shares started at 247.57, peaked at 255.25, bottomed out at 244.66, and ended 0.67% higher at 249.24, with 3896621 shares traded.The stock's peak price over the last 52 weeks is 326.46, with the lowest being 218.58.
Technicals
Support and Resistance: At 249.24, the price is supported at 243.61 and faces resistance at 250.53. This range suggests that the price for CME might stay between these levels, with 243.61 acting as a floor and 250.53 as a ceiling.
Aroon: The bullish trend in Aroon remains, with Aroon Up consistently at the 100 level. This points to sustained upward momentum, but the trend should be explored further alongside other indicators to better understand its implications.

Bol. Bands: The current state of the BOLL BANDS is neutral, with no clear trend direction indicated. This lack of directional bias suggests that the market may be in a phase of consolidation or uncertainty.

Parabolic SAR: The PSAR continues to indicate a bullish outlook, setting a crucial support level. This strong support could bolster the ongoing upward trend, suggesting that the market may remain in a positive trajectory. Investors may view this as a sign of sustained bullish momentum.

Stochastic: The current state of the STOCHASTIC is neutral, offering no clear signals of movement in either direction. This suggests a potential pause in market activity, with no strong trend emerging at the moment.

Tripple Moving Agerage: The 20-50-100 period moving averages are positioned for a bullish trend, but the slopes of the faster averages hint at a possible trend reversal. While the overall outlook remains positive, the weakening momentum in the shorter-term averages suggests that the current trend might not hold for long.

To properly assess the technical data of a company, it's important to first look at its fundamentals, such as its earnings, growth potential, and management effectiveness. Equally, understanding the industry trends, competition, and external economic factors that influence the company is vital. This holistic view helps draw meaningful conclusions about the company's technical performance, allowing investors to better gauge its stock price behavior, volatility, and market trends.
If you have enjoyed reading, spread the word:
Good prospects:
Companies with the best and the worst technicals.
Latest Regulatory Filings for SP5
Companies with the best and the worst fundamentals.
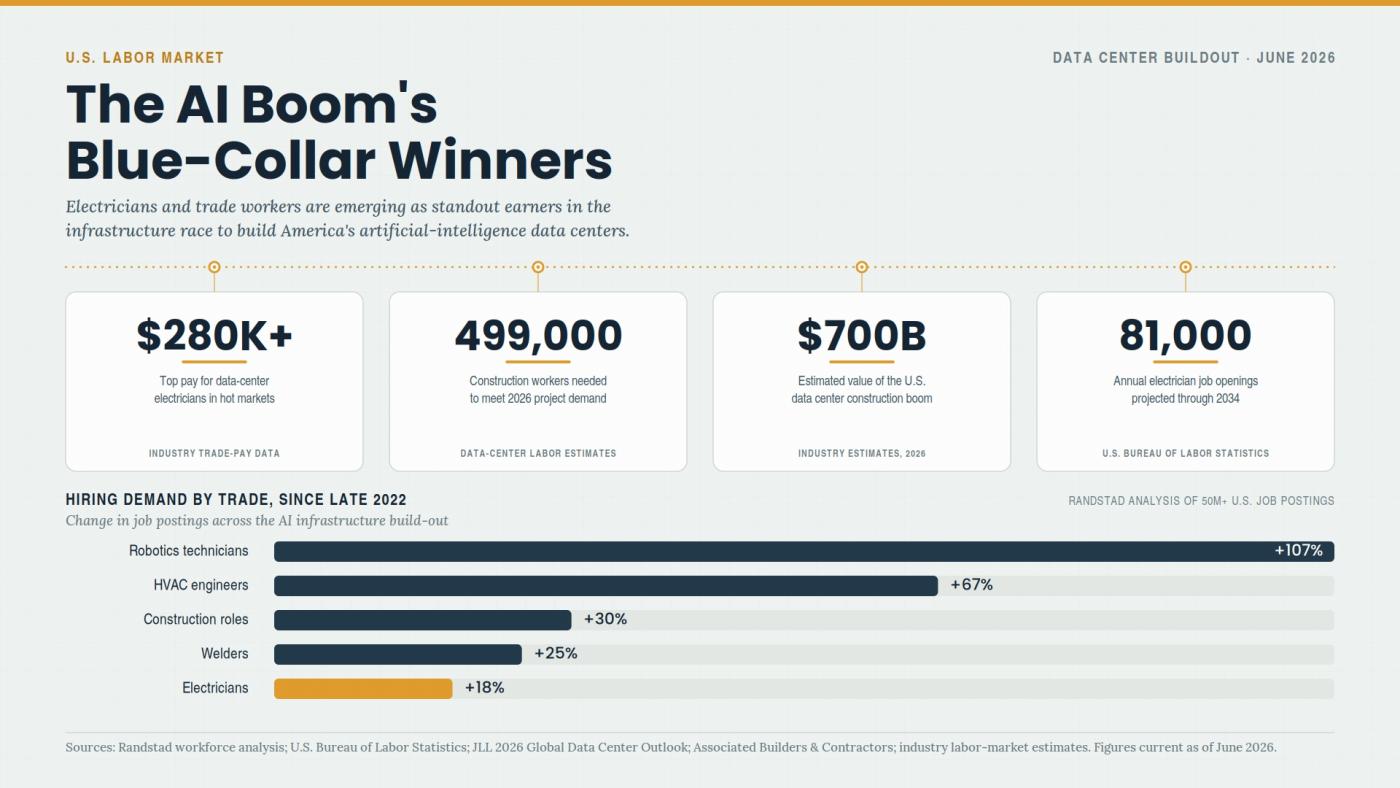
Why Electricians Now Out-Earn Software Engineers
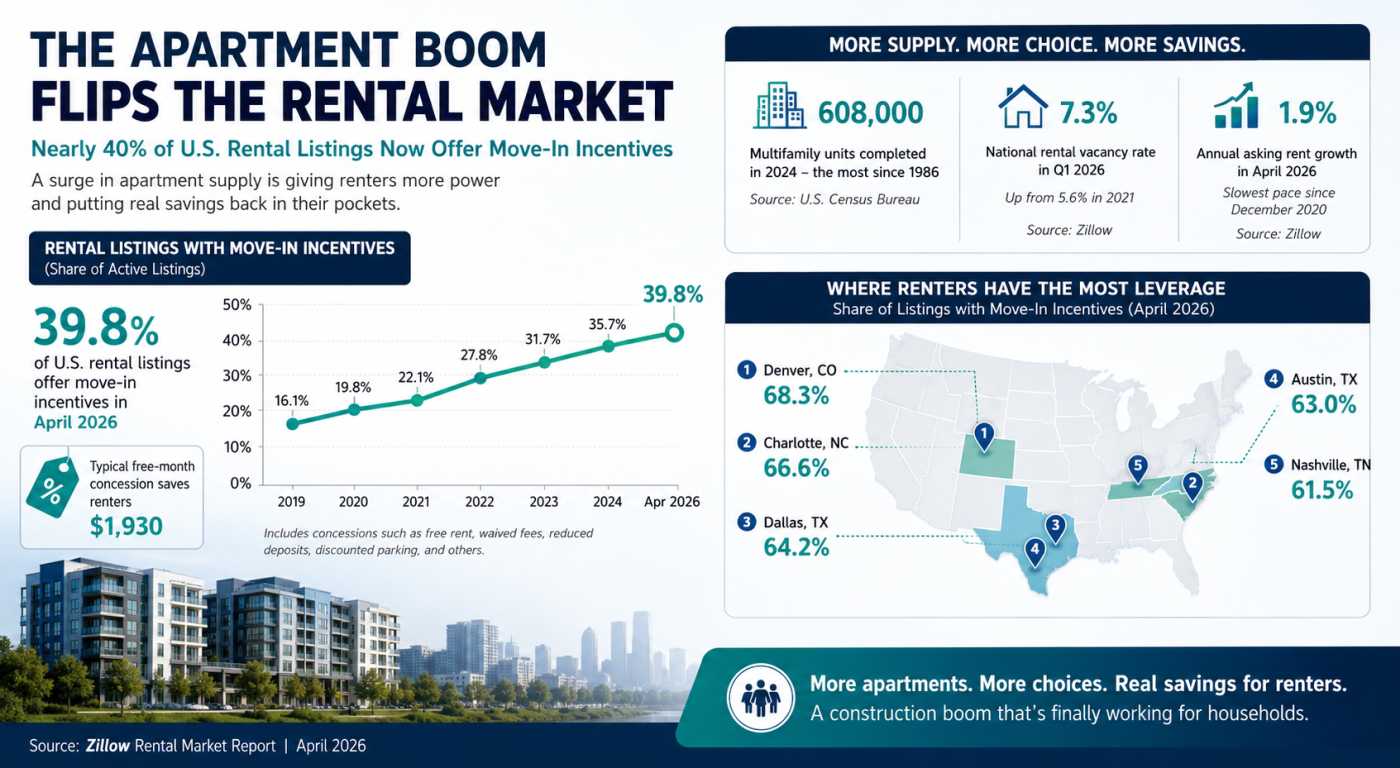
The Apartment Glut Changing America’s Rental Market
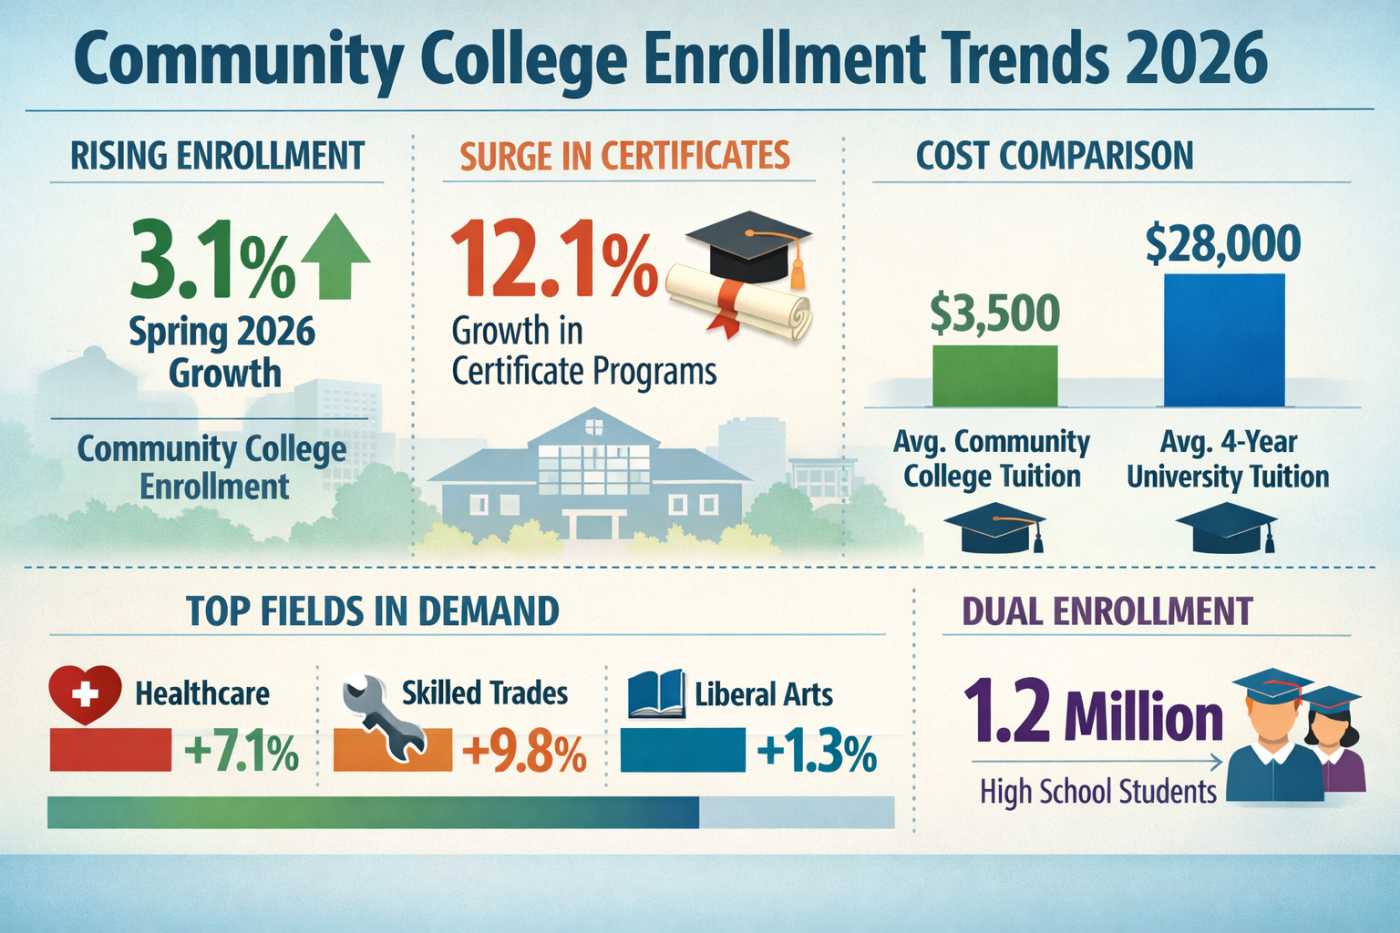
Why Community Colleges Are Winning Again
