More about Comcast Corporation
Regulatory Filings for Comcast Corporation
Fundamentals for Comcast Corporation

Diversification Shielded U.S. Banks

Repo, Debt and Risk: The Fed's Untold Warning for 2026

When Losing Money Pays: America's Broken Market Logic

The Hidden Time Bomb in AI Finance
Technicals for Comcast Corporation


Price Summary
In today's trading session, CMCSA's shares slumped by -3.0%, marking a unimpressive day.Comcast Corporation's stock opened at 24.25 on 2026-07-22, surged to 24.25, dropped to 23.49, and ended -3.0% down at 23.52, with 36401433 shares traded.
In the last 52 weeks, the stock's top price was 33.15 and the bottom price was 22.32.
Technicals
Support and Resistance: The price of 23.52 is supported at 23.33 and faces resistance at 24.93. This range suggests key levels for CMCSA where the price may stabilize, with 23.33 acting as a support and 24.93 as a cap on gains.
Aroon: The AROON is in a neutral stance, with no clear signals for movement up or down. This neutral position indicates a potential period of consolidation or uncertainty in the market.

Bol. Bands: The current state of the BOLL BANDS is neutral, offering no clear signals of movement in either direction. This suggests a potential pause in market activity, with no strong trend emerging at the moment.

Parabolic SAR: The PSAR maintains its bullish stance, setting a significant support level that could help maintain the market's upward movement. This strong support suggests that the market is poised to continue its positive trend, providing confidence in the ongoing bullish momentum.

Stochastic: The STOCHASTIC is currently neutral, showing no clear bias toward an upward or downward trend. This suggests that the market may be in a phase of indecision or consolidation.

Tripple Moving Agerage: The current state of the Tripple MOVING AVG is neutral for CMCSA, providing no clear indication of a trend in either direction. This suggests that the market may be lacking momentum, making it difficult to predict future movements.

A company's technical data, including stock price and trading volume, can provide valuable insights when considered alongside its fundamentals. These include financial performance, market share, and growth strategy, as well as broader industry dynamics. Examining these factors helps investors or analysts make more informed decisions, as the company's fundamentals offer context for understanding how and why certain technical patterns may emerge in the market.
If you have enjoyed reading, spread the word:
Good prospects:
Companies with the best and the worst technicals.
Latest Regulatory Filings for SP5
Companies with the best and the worst fundamentals.
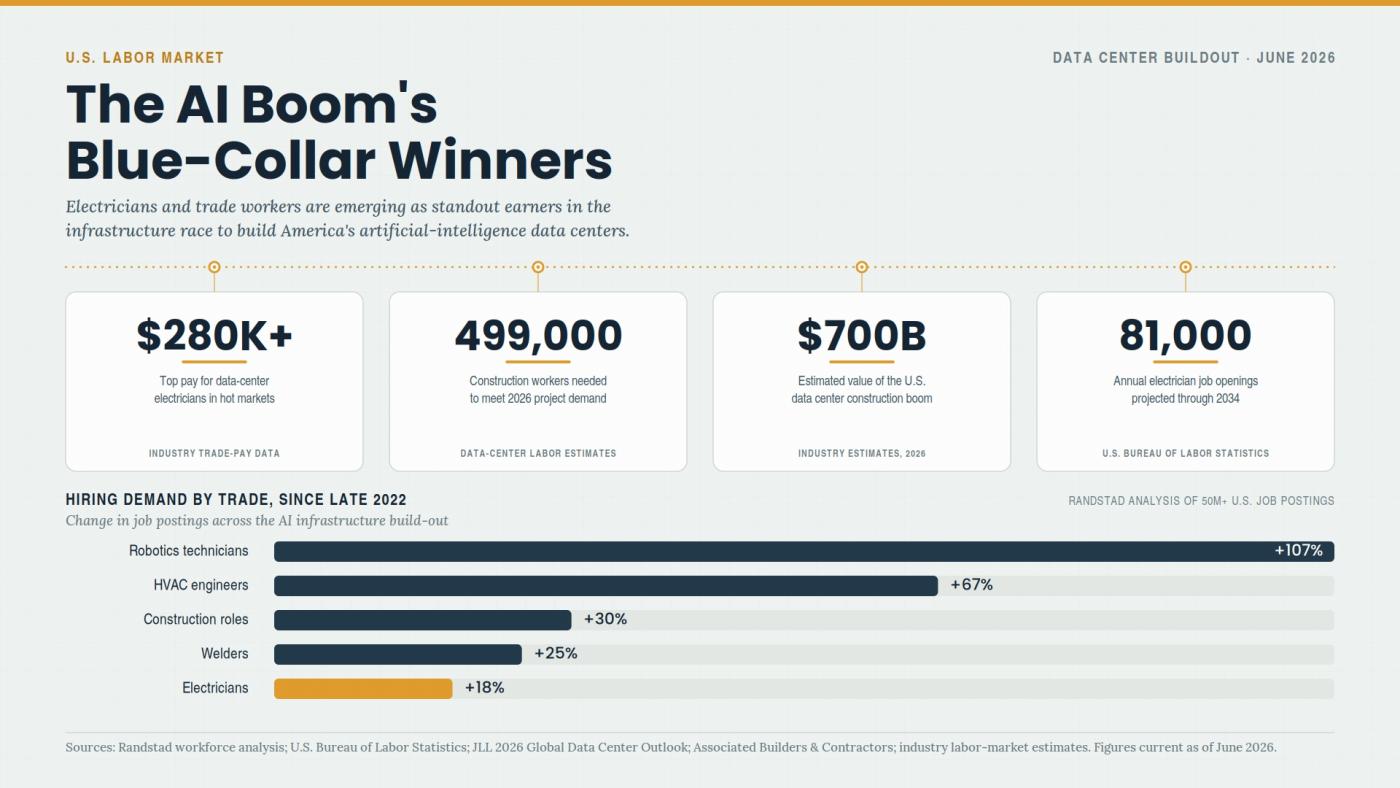
Why Electricians Now Out-Earn Software Engineers
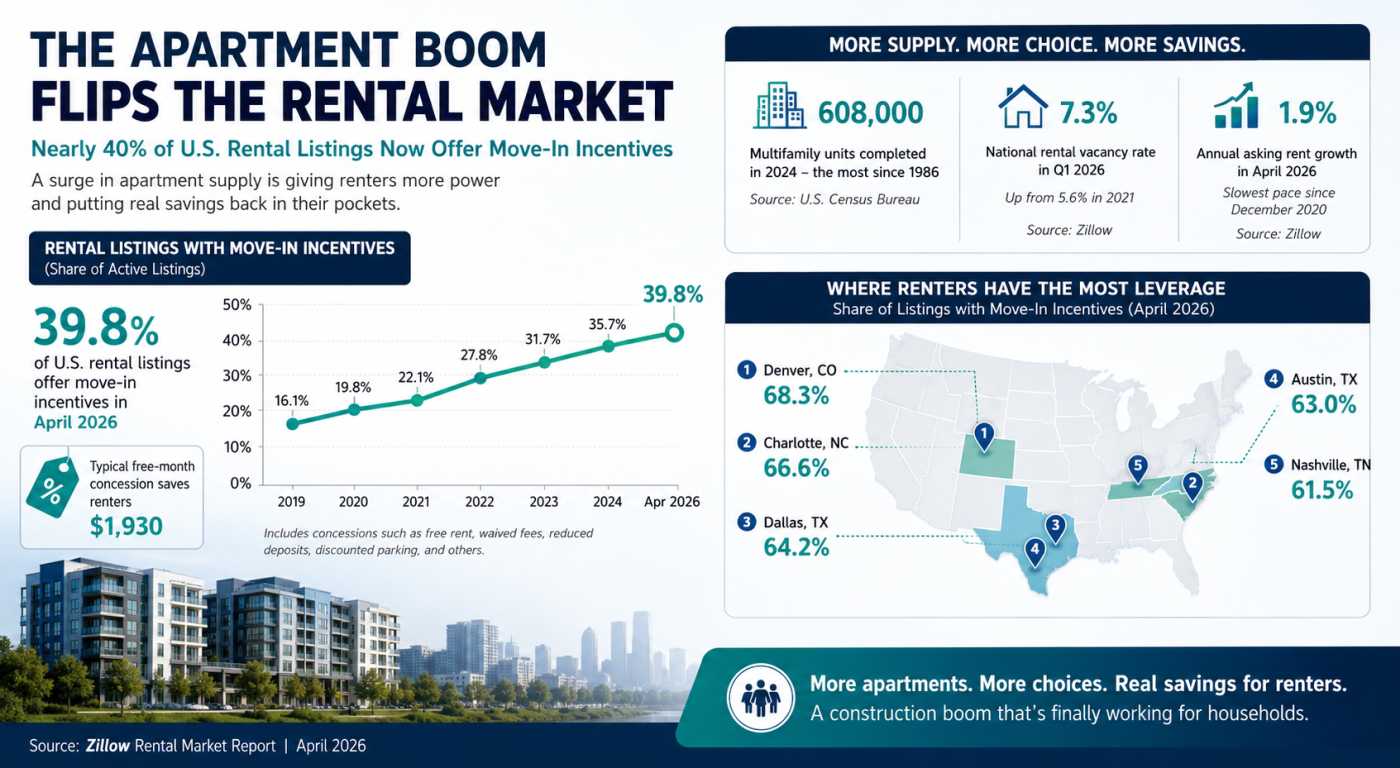
The Apartment Glut Changing America’s Rental Market
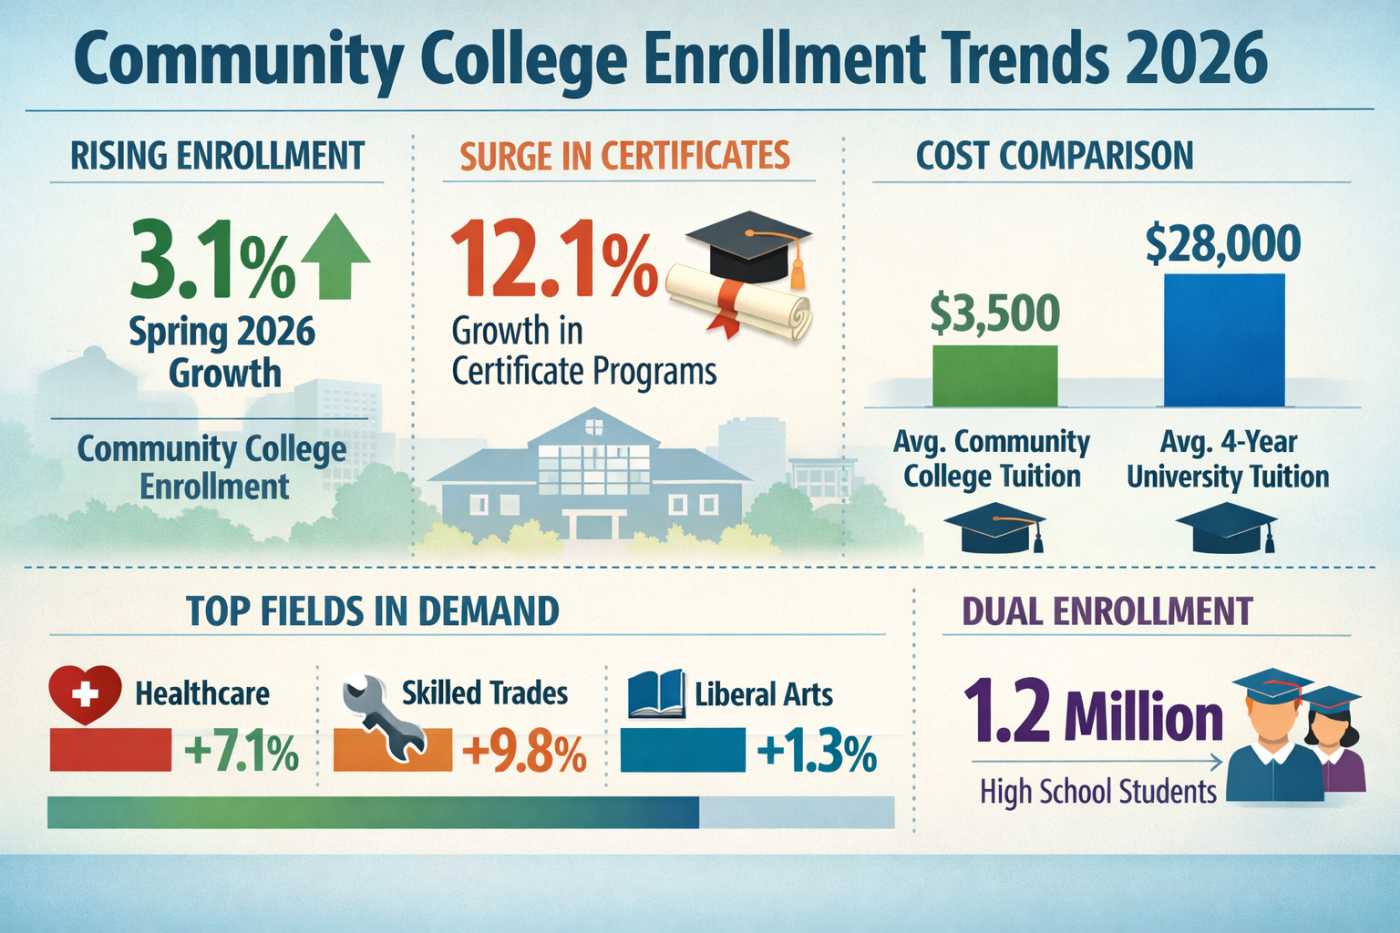
Why Community Colleges Are Winning Again
