More about Charter Communications, Inc.
Regulatory Filings for Charter Communications, Inc.
Fundamentals for Charter Communications, Inc.

Diversification Shielded U.S. Banks

Repo, Debt and Risk: The Fed's Untold Warning for 2026

When Losing Money Pays: America's Broken Market Logic

The Hidden Time Bomb in AI Finance
Technicals for Charter Communications, Inc.


Price Summary
On 2026-07-22, CHTR's stock started at 130.78, reached a high of 130.8, fell to 125.44, and ended -1.19% lower at 129.22, with 2993131 shares traded.Over the previous 52 weeks, the stock reached a high of 380.0 and a low of 125.54.
Technicals
Support and Resistance: With the current price at 129.22, support is found at 125.54 and resistance at 143.71. These levels indicate where buyers might step in at 125.54, while sellers could limit gains at 143.71, defining a trading boundary for Charter Communications, Inc..
Aroon: The continuation of Aroon's bearish trend, with Aroon Down at the 100 level, indicates sustained bearish pressure. However, this trend should be analyzed further alongside other indicators to better understand its long-term implications.

Bol. Bands: The current reading of the BOLL BANDS indicator suggests a neutral stance, with no clear signals indicating an upward or downward direction. This lack of directional bias suggests the market may be in a period of consolidation or uncertainty.

Parabolic SAR: The PSAR for CHTR continues to signal a bearish stance, reinforcing a resistance level that could restrict upward movement. This resistance suggests that the market may remain under bearish pressure, with limited potential for breaking higher.

Stochastic: With the K-line positioned above the D-line and under 20 on the stochastic indicator, a bullish move may be beginning for CHTR. This pattern suggests that the market could be preparing for an upward trend, emerging from a period of lower levels. Investors might interpret this as a signal for potential growth.

Tripple Moving Agerage: The Tripple MOVING AVG is showing a neutral stance, with no definitive indication of an upward or downward trend for CHTR. This neutral position suggests a period of indecision in the market, making it difficult to predict the next move.

A thorough analysis of a company involves looking beyond its stock price movements and trading patterns. You must also examine its fundamentals, which include profitability, growth prospects, and competitive advantages. Additionally, the industry in which the company operates provides important context, as factors like technological innovations, regulation, and market demand influence performance. By integrating this information with technical analysis, more accurate predictions about the company's future can be made.
If you have enjoyed reading, spread the word:
Good prospects:
Companies with the best and the worst technicals.
Latest Regulatory Filings for SP5
Companies with the best and the worst fundamentals.
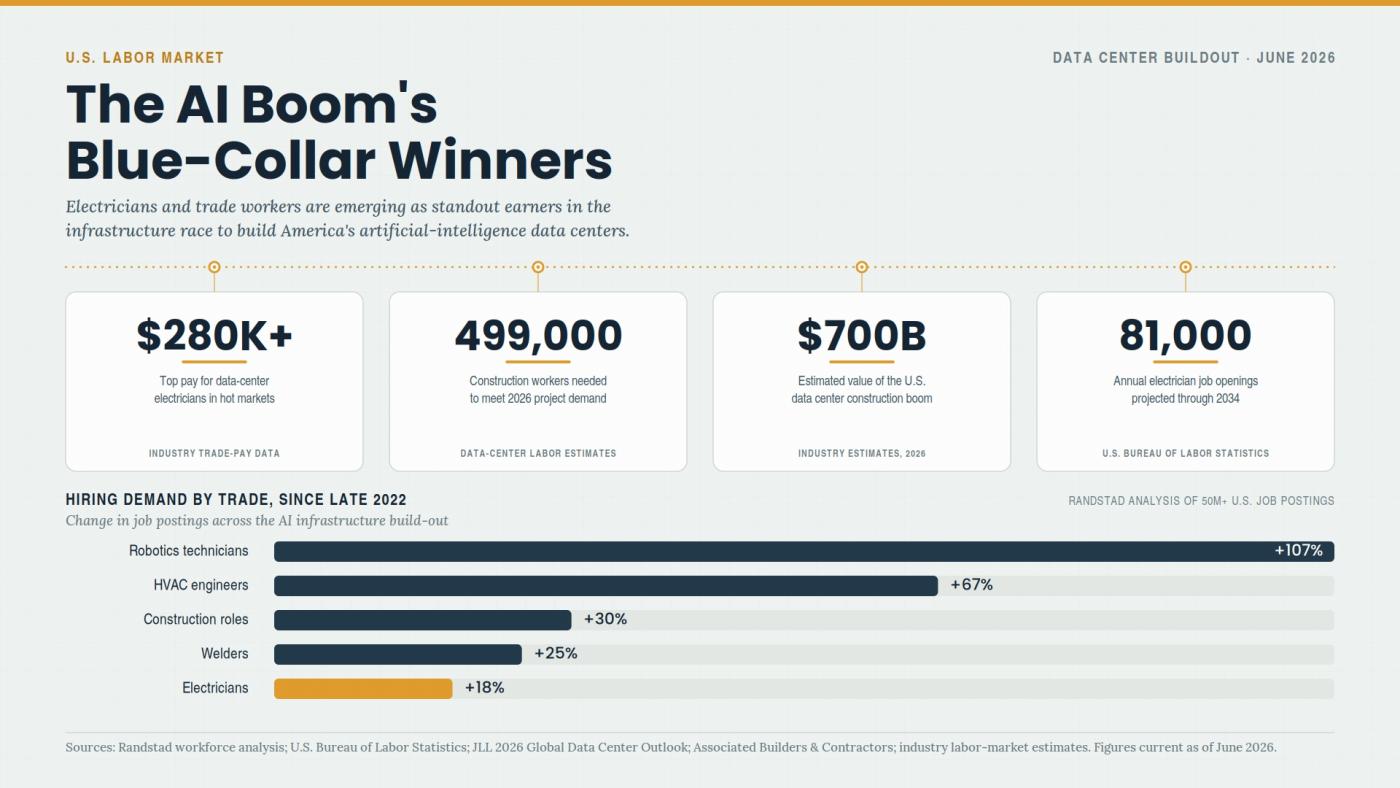
Why Electricians Now Out-Earn Software Engineers
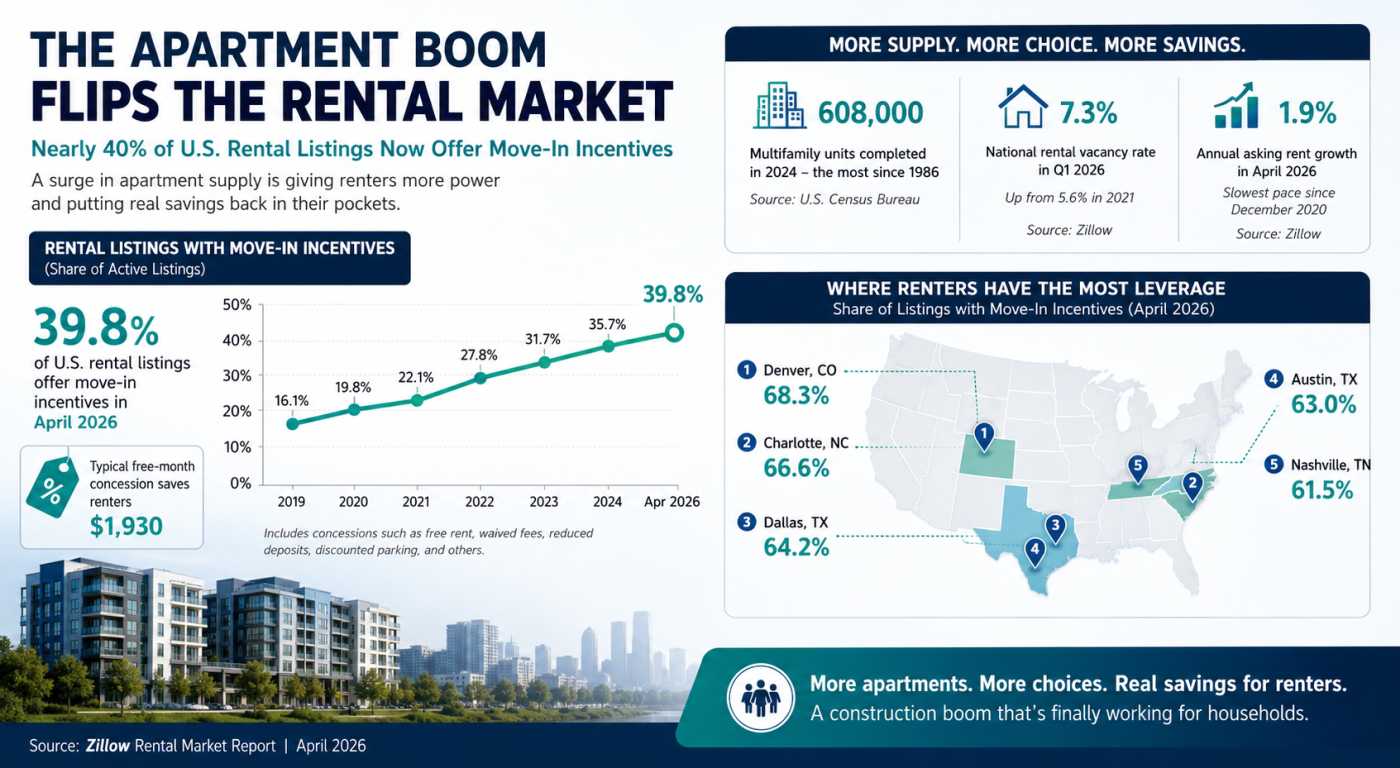
The Apartment Glut Changing America’s Rental Market

Why Community Colleges Are Winning Again
