

Diversification Shielded U.S. Banks

Repo, Debt and Risk: The Fed's Untold Warning for 2026

When Losing Money Pays: America's Broken Market Logic

The Hidden Time Bomb in AI Finance
Technicals for BlackRock, Inc.



Price Summary
On 2026-07-22, BlackRock, Inc.'s stock began at 1036.6, peaked at 1057.19, declined to 1034.34, and ended the day 1.93% up at 1056.63, with 580968 shares traded.During the past 52 weeks, the highest stock price was 1202.59, and the lowest was 922.9.
Technicals
Support and Resistance: The current price of 1056.63 for BLK is supported at 1055.63 and faces resistance at 1087.78. These levels indicate that 1055.63 could act as a floor, while 1087.78 might limit any further price increases.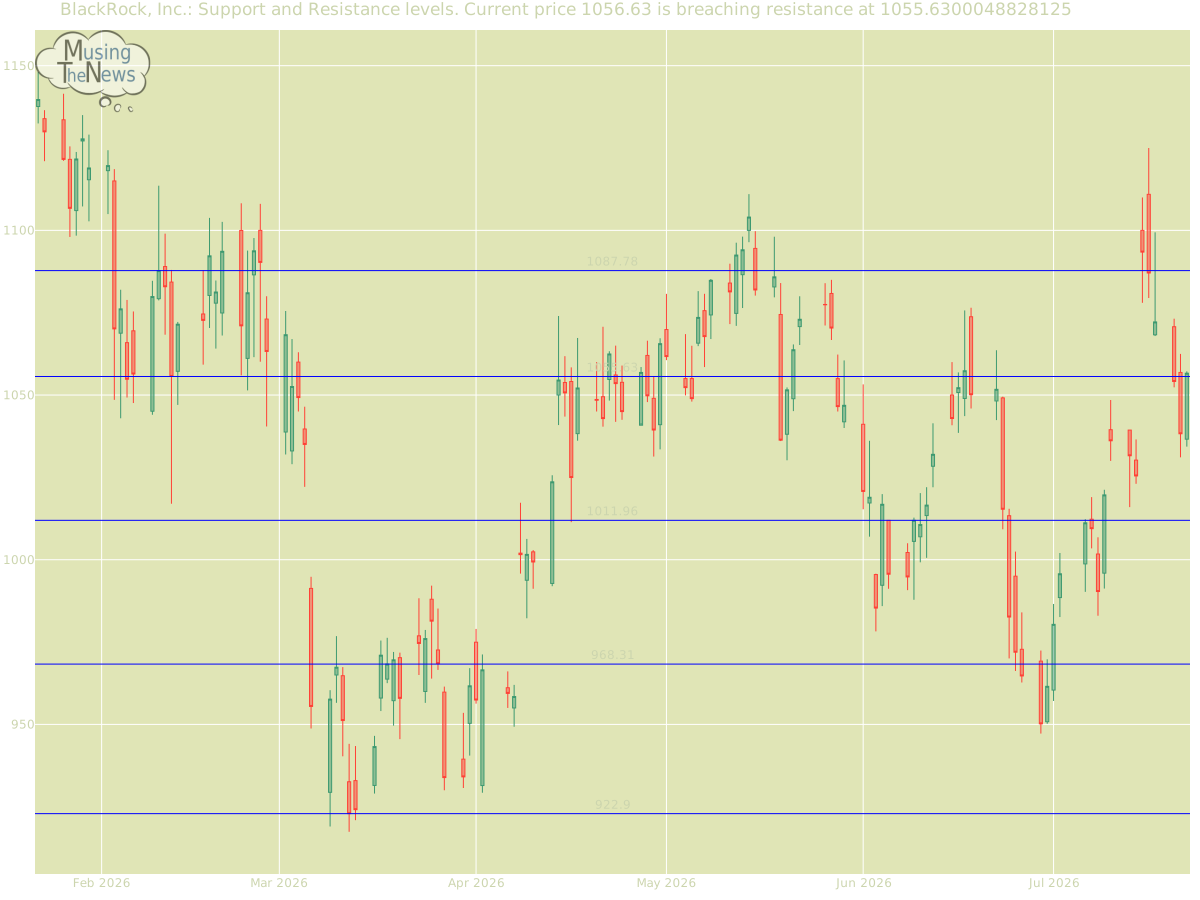
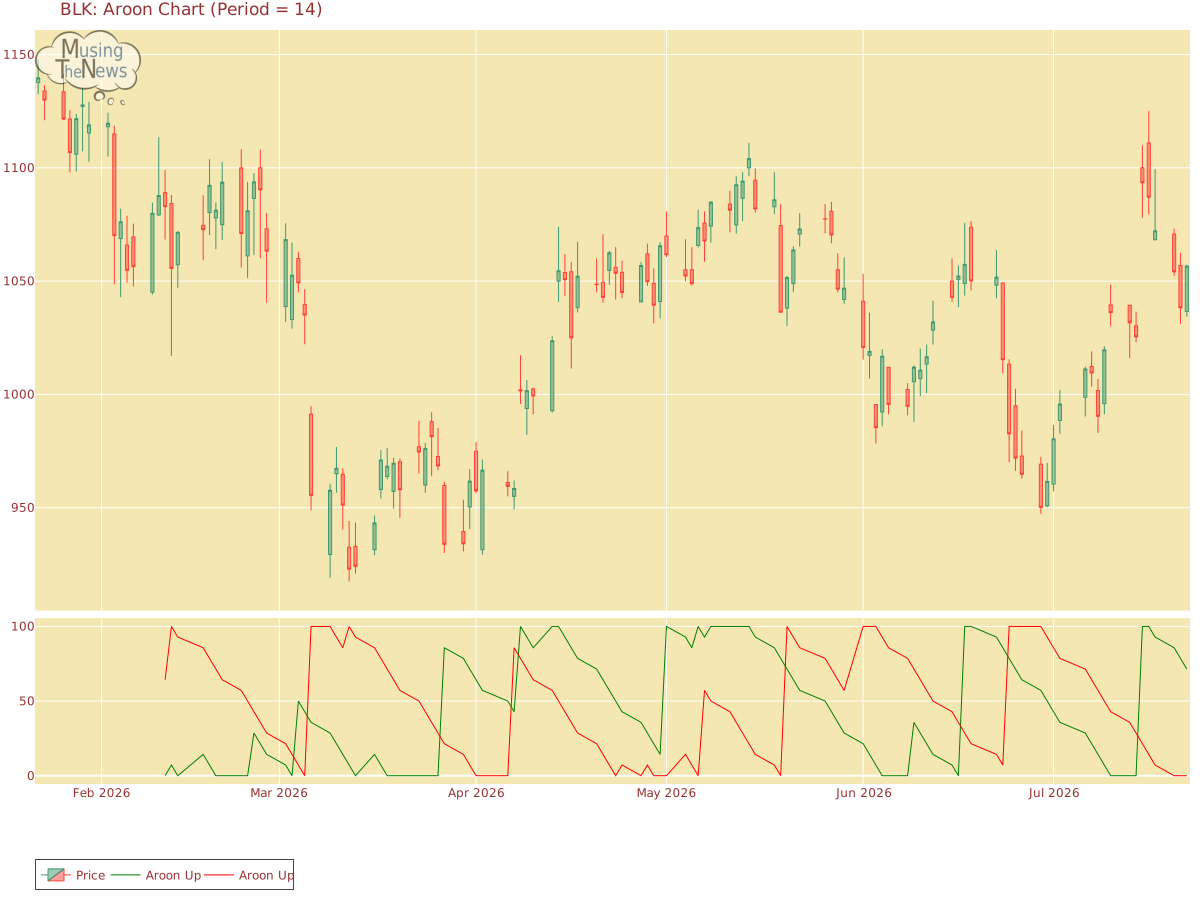
Aroon: The AROON is showing a neutral stance, with no definitive indication of an upward or downward trend for BLK. This neutral position suggests a period of indecision in the market, making it difficult to predict the next move.
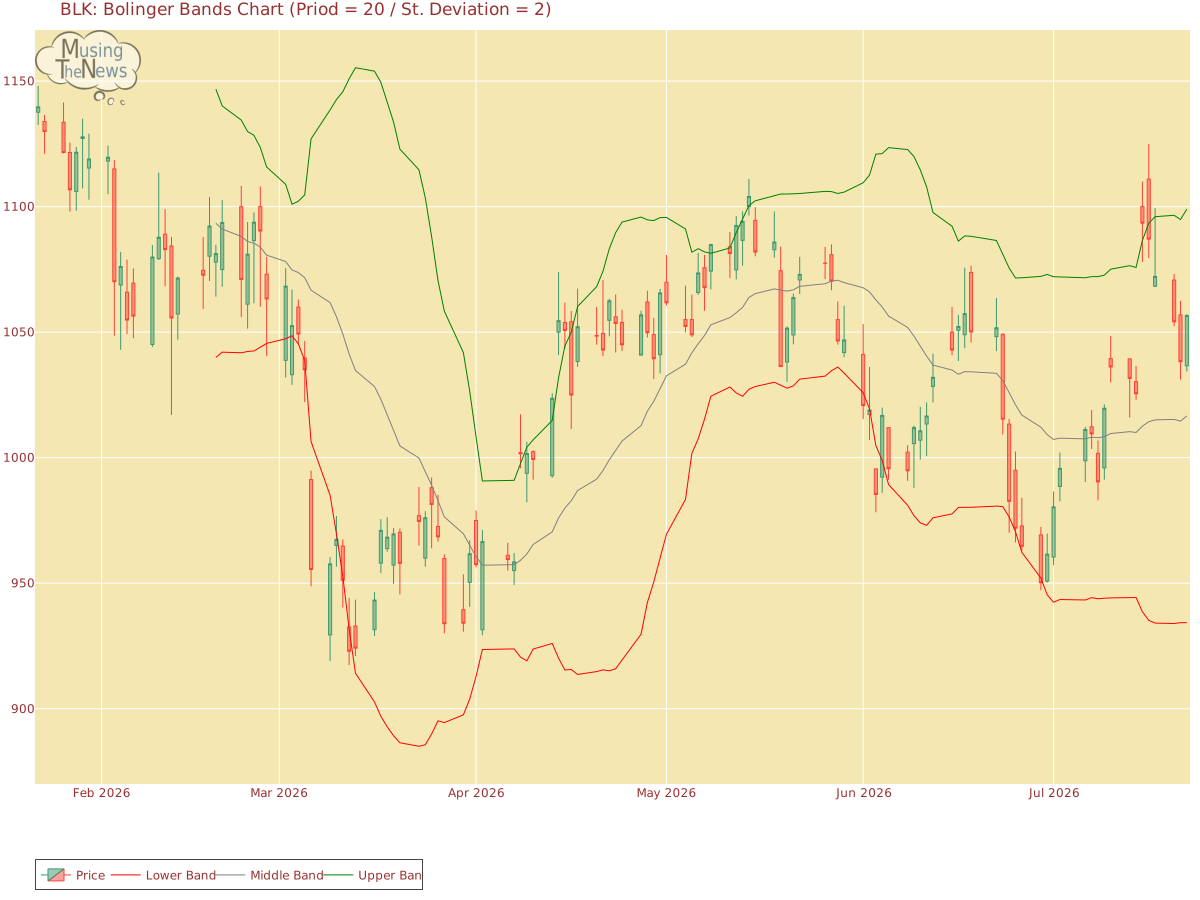
Bol. Bands: The current state of the BOLL BANDS is neutral, with no clear trend direction indicated. This lack of directional bias suggests that the market may be in a phase of consolidation or uncertainty.
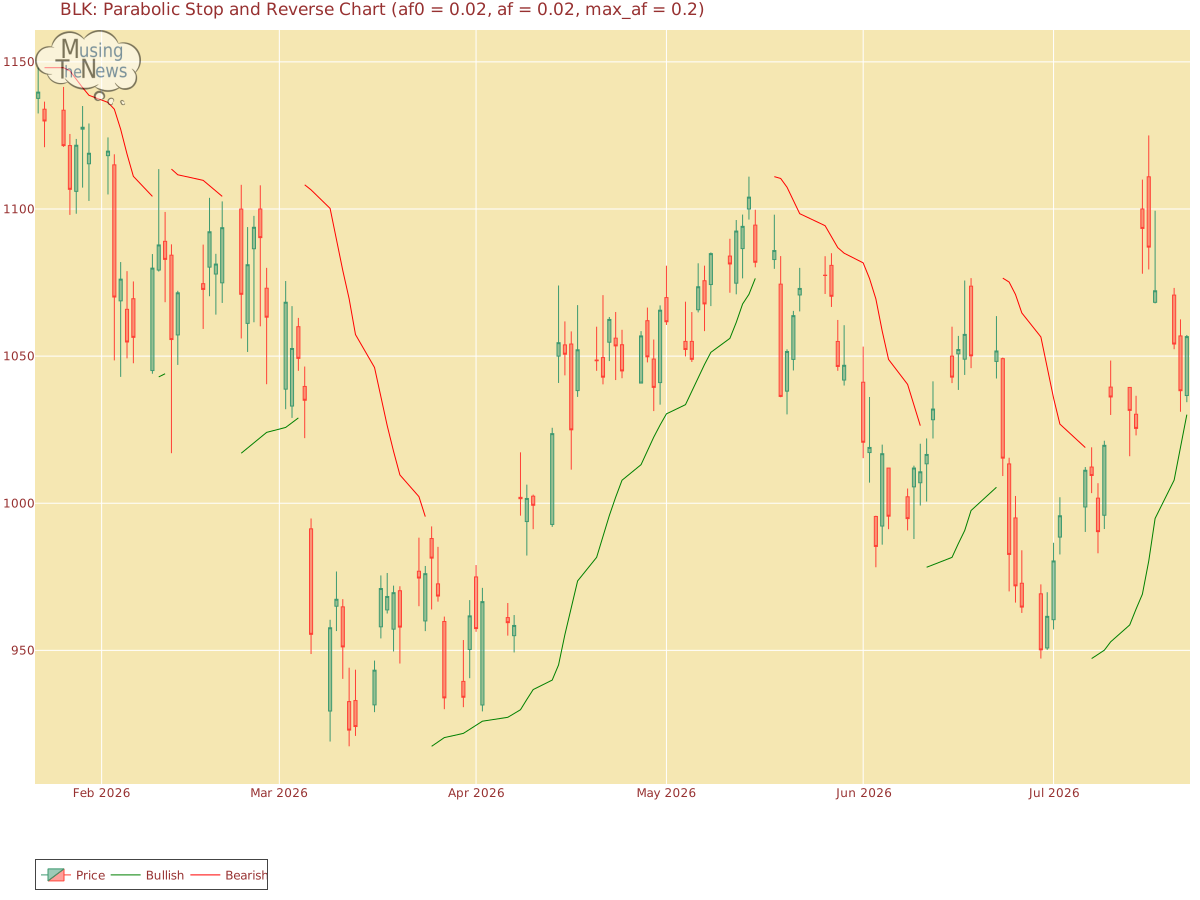
Parabolic SAR: The PSAR maintains its bullish stance, setting a significant support level that could help maintain the market's upward movement. This strong support suggests that the market is poised to continue its positive trend, providing confidence in the ongoing bullish momentum.
Stochastic: The current reading of the STOCHASTIC indicator suggests a neutral stance, with no clear signals indicating an upward or downward direction. This lack of directional bias suggests the market may be in a period of consolidation or uncertainty.
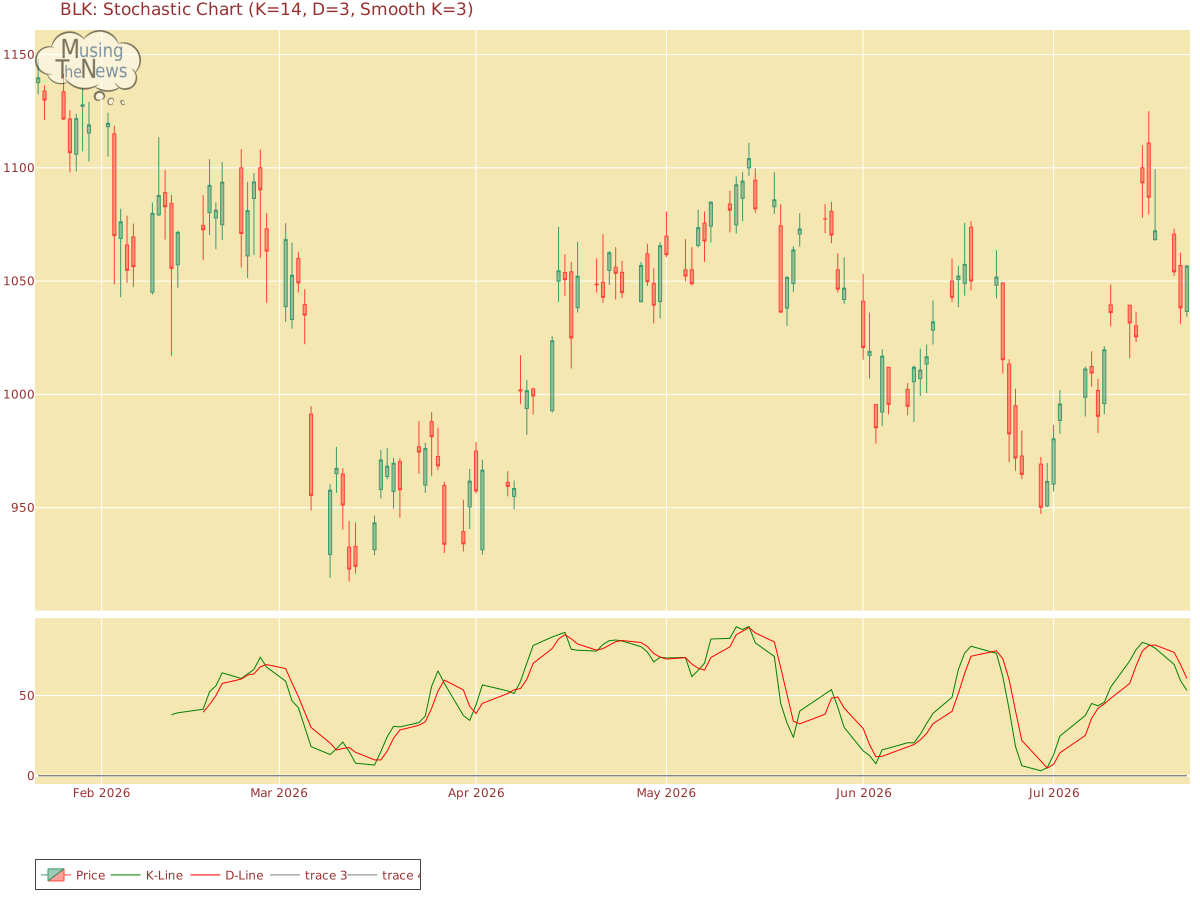
Tripple Moving Agerage: The current state of the Tripple MOVING AVG is neutral, providing no clear signals for either an upward or downward movement. This indicates that the market may be in a state of equilibrium, with no strong momentum in either direction.
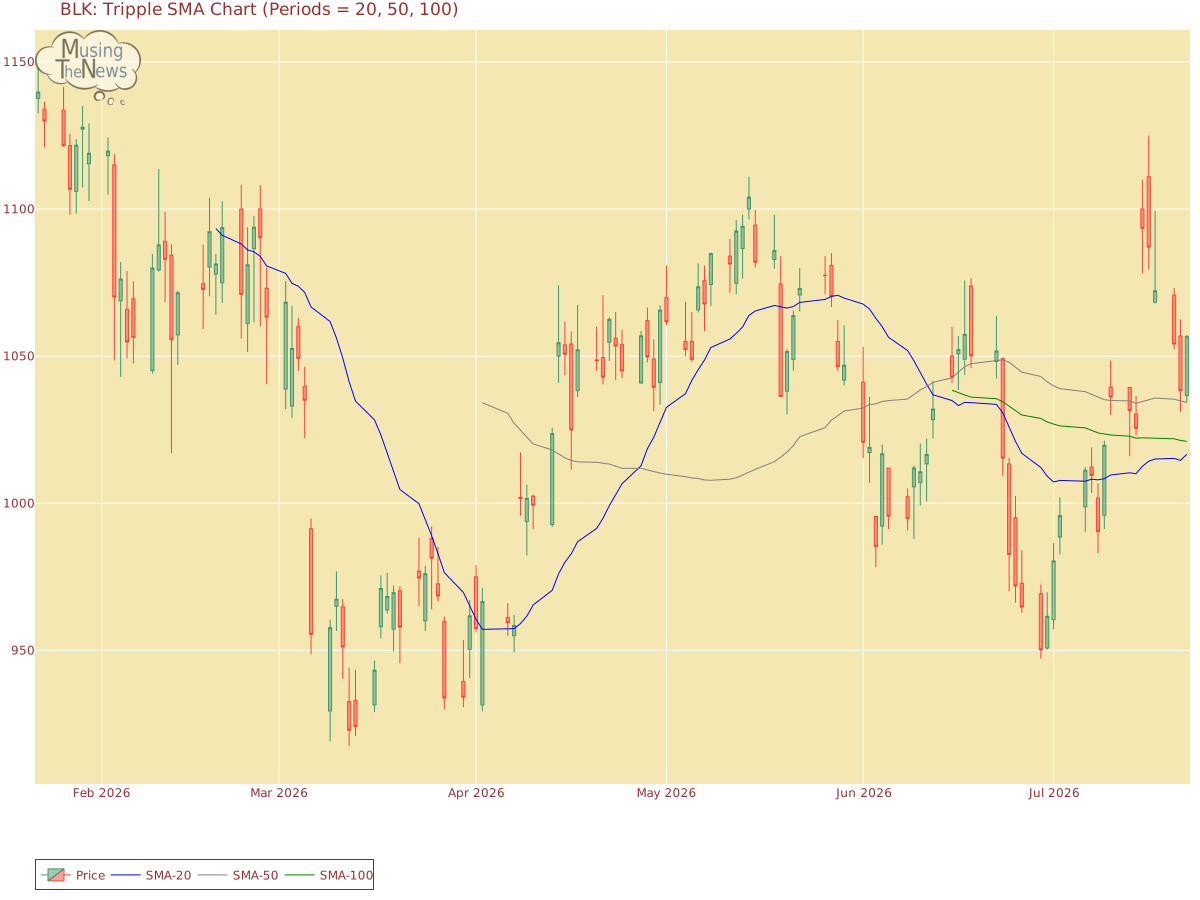
A thorough analysis of a company involves looking at both its fundamentals and technical data. The fundamentals, including revenue, profitability, and management quality, offer insight into the company's long-term value. Additionally, understanding the broader industry context, such as market competition and regulatory challenges, helps to better interpret the company's stock performance. By combining both fundamental and technical analysis, you can derive more meaningful inferences about the company's future prospects.
If you have enjoyed reading, spread the word:
Good prospects:
Companies with the best and the worst technicals.
Latest Regulatory Filings for SP5
Companies with the best and the worst fundamentals.
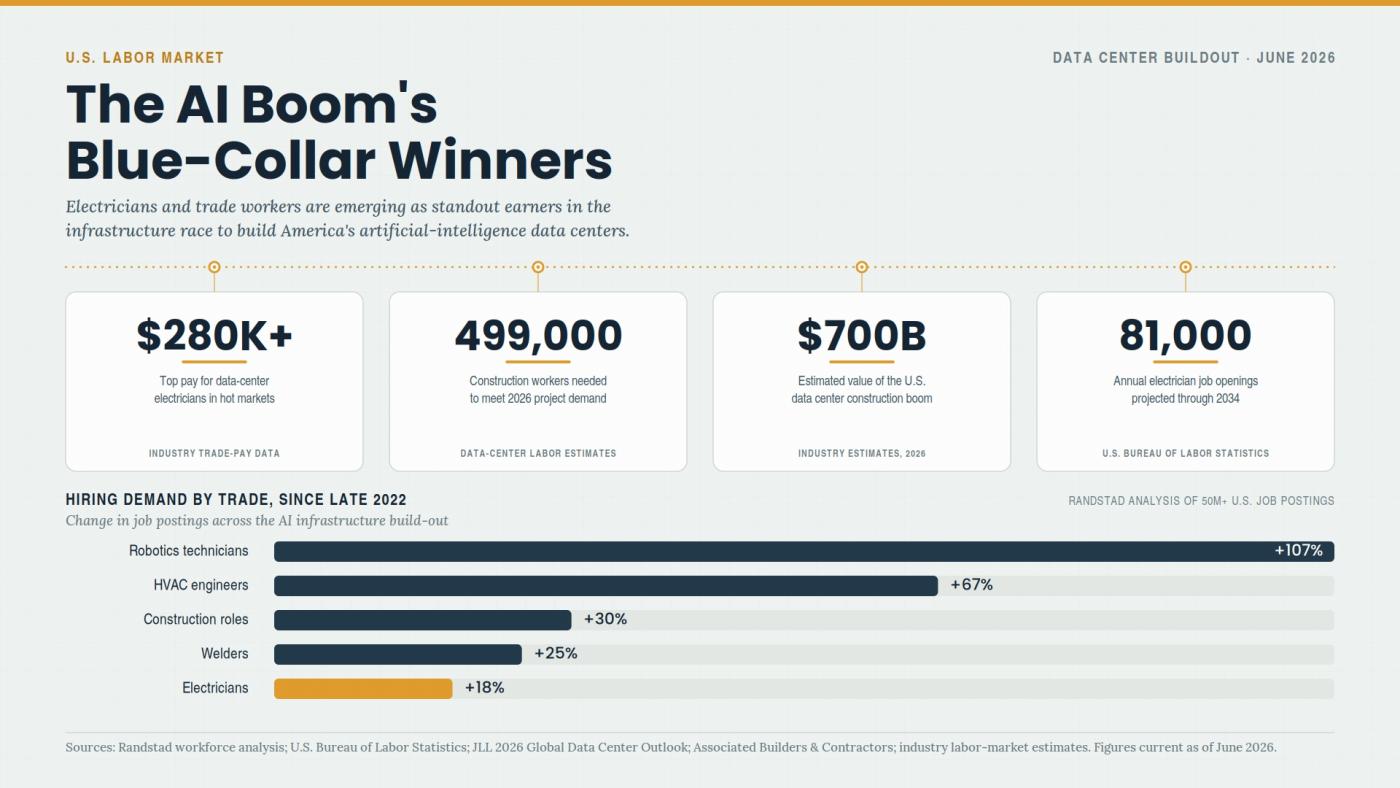
Why Electricians Now Out-Earn Software Engineers

The Apartment Glut Changing America’s Rental Market
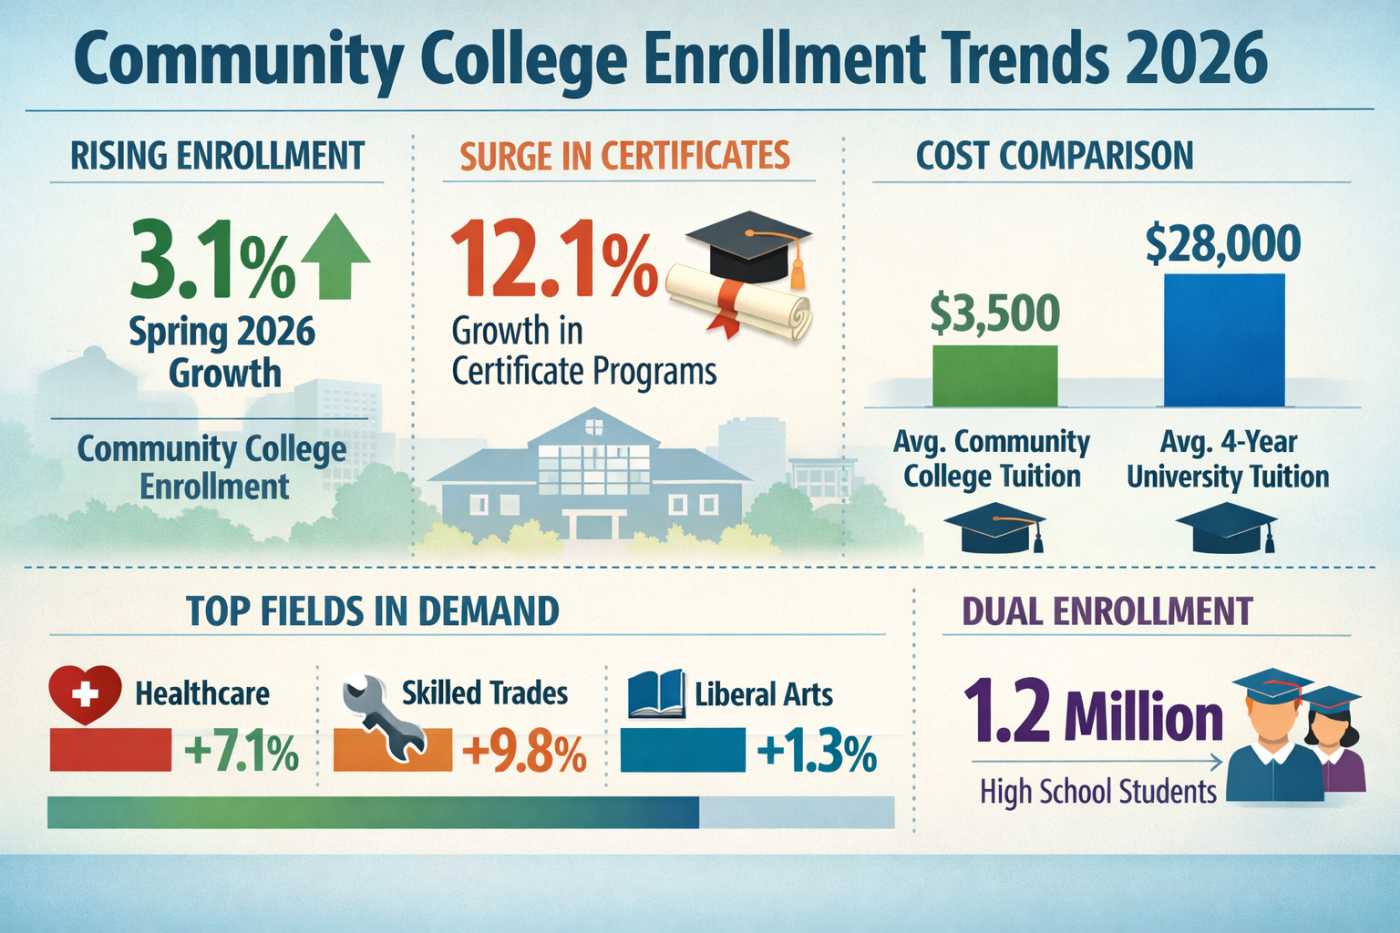
Why Community Colleges Are Winning Again