More about Becton, Dickinson and Company
Regulatory Filings for Becton, Dickinson and Company
Fundamentals for Becton, Dickinson and Company

Diversification Shielded U.S. Banks

Repo, Debt and Risk: The Fed's Untold Warning for 2026

When Losing Money Pays: America's Broken Market Logic

The Hidden Time Bomb in AI Finance
Technicals for Becton, Dickinson and Company


Price Summary
On 2026-07-22, Becton, Dickinson and Company's stock began at 154.87, peaked at 155.33, bottomed at 152.53, and closed -1.1% lower at 153.16, with a volume of 1155208 shares.The stock's highest price in the past 52 weeks is 185.39, while its lowest price during the same period is 135.54.
Technicals
Support and Resistance: The price of 153.16 is supported at 149.43 and faces resistance at 158.09. This range suggests key levels for BDX where the price may stabilize, with 149.43 acting as a support and 158.09 as a cap on gains.
Aroon: The current state of the AROON is neutral, with no clear trend direction indicated. This lack of directional bias suggests that the market may be in a phase of consolidation or uncertainty.

Bol. Bands: The current reading of the BOLL BANDS indicator suggests a neutral stance, with no clear signals indicating an upward or downward direction. This lack of directional bias suggests the market may be in a period of consolidation or uncertainty.

Parabolic SAR: The PSAR remains bullish in its outlook, establishing a key support level that could serve as a foundation for further upward movement. This persistent bullish stance suggests that the market may continue to trend higher, with the established support providing a potential safety net for investors.

Stochastic: The STOCHASTIC is in a neutral stance, with no clear direction indicated for the market. This lack of clarity suggests that the market may be in a state of equilibrium for BDX, with no strong trend emerging.

Tripple Moving Agerage: The Tripple MOVING AVG is currently neutral, showing no clear bias toward an upward or downward trend. This suggests that the market may be in a phase of indecision or consolidation.

Before diving into the technical aspects of a company, such as stock price charts or volume trends, it's important to understand its fundamentals. These fundamentals include financial stability, growth potential, and strategic positioning. Additionally, knowing the broader industry landscape, including competitive pressures and regulatory factors, offers deeper insights. When this fundamental analysis is combined with technical indicators, it leads to more informed, accurate evaluations of the company's overall performance.
If you have enjoyed reading, spread the word:
Good prospects:
Companies with the best and the worst technicals.
Latest Regulatory Filings for SP5
Companies with the best and the worst fundamentals.
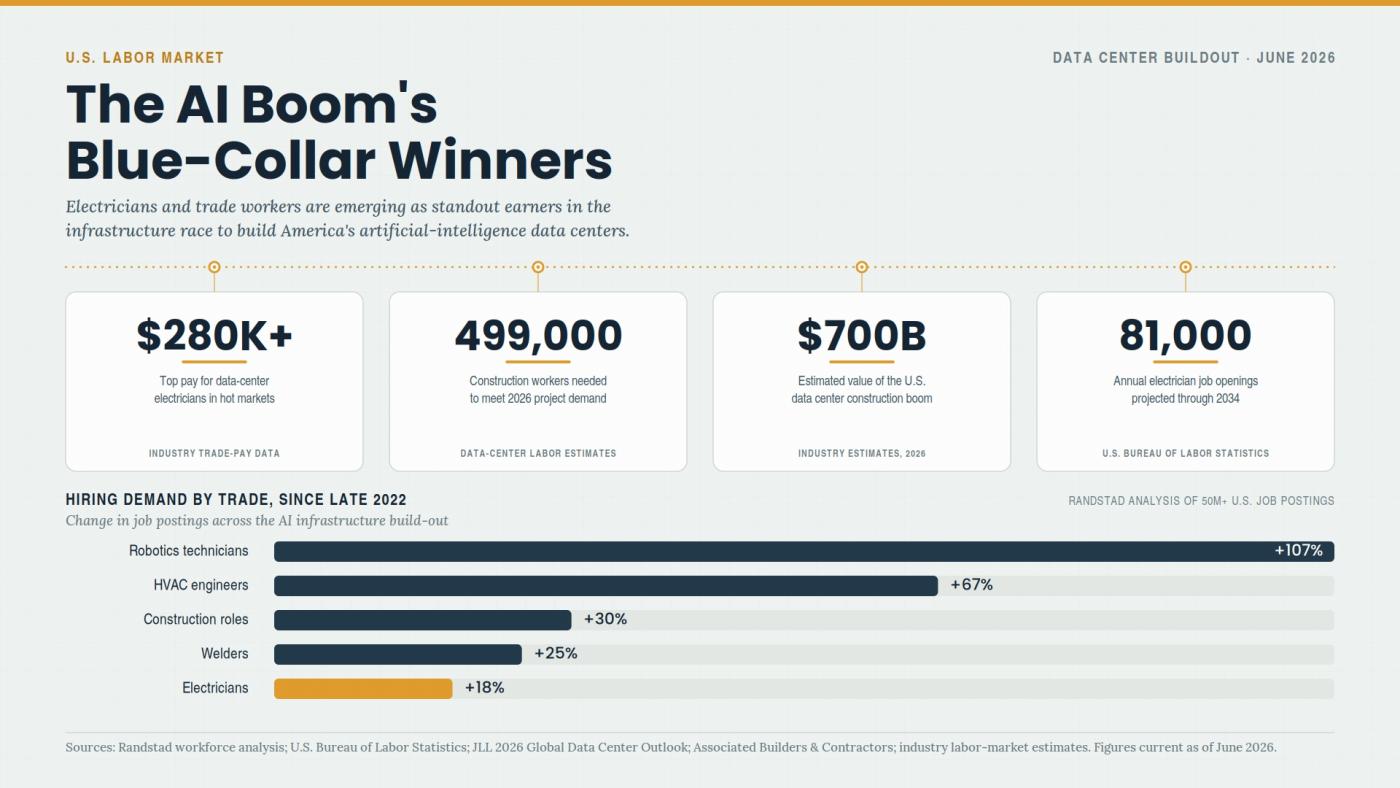
Why Electricians Now Out-Earn Software Engineers

The Apartment Glut Changing America’s Rental Market

Why Community Colleges Are Winning Again
