More about Axon Enterprise, Inc.
Regulatory Filings for Axon Enterprise, Inc.
Fundamentals for Axon Enterprise, Inc.

The Machines That Ate the Grid: Five Centuries of Power Hunger
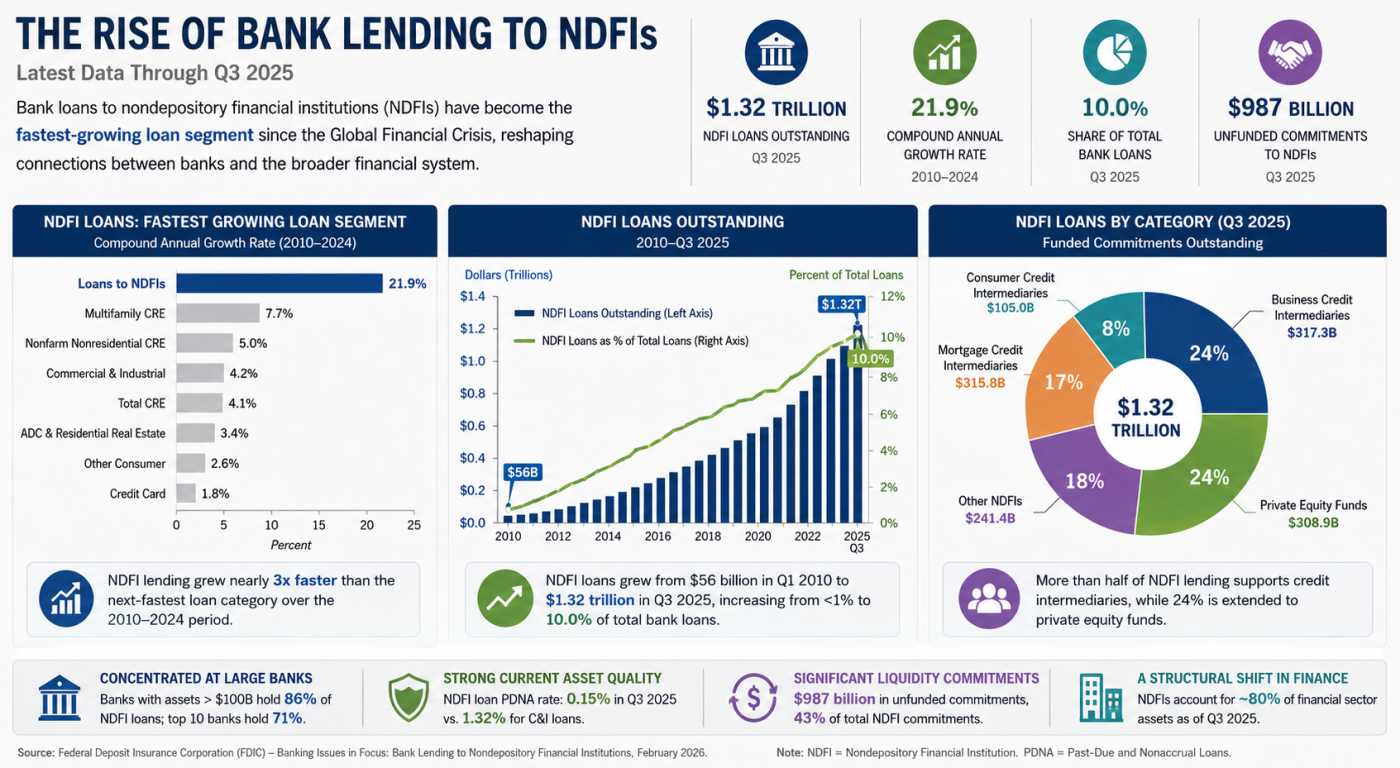
Private Credit’s Secret Banking Backbone Is Growing Faster Than Anyone Expected

America's $5 Trillion Business Handoff Has Already Begun

The Repair Economy Boom in Rural America
Technicals for Axon Enterprise, Inc.


Price Summary
Axon Enterprise, Inc.'s stock saw a -6.37% decrease, showcasing an poor market day.Axon Enterprise, Inc.'s stock, on 2026-05-08 opened at 431.01, climbed to a high of 432.76, dropped to a low of 392.56, and closed up -6.37% at 403.54, with 1744365 shares traded.
The highest price the stock achieved in the past 52 weeks is 870.97, while the lowest price it saw is 345.94.
Technicals
Support and Resistance: The current price of 403.54 for AXON finds support at 385.86 and resistance at 414.2. These levels define a range in which the price might oscillate, with 385.86 as a potential support and 414.2 as a resistance level.
Aroon: The AROON is in a neutral stance for AXON, not indicating a clear upward or downward trend. This suggests a period of market indecision, where neither bulls nor bears have the upper hand.

Bol. Bands: The price crossing below the upper Bollinger Band signals a potential bearish reversal. This movement may indicate that the asset's recent bullish trend is weakening, and a decline could follow. Traders often interpret this as a sign that the market is overbought, suggesting that a correction or pullback is likely, making it a crucial time to consider adjusting trading positions.

Parabolic SAR: The PSAR for AXON maintains its bullish outlook, setting a strong support level that could underpin further gains. This suggests that the market is likely to continue its upward trajectory, with the established support providing a safety net for ongoing bullish momentum.

Stochastic: The STOCHASTIC is in a neutral stance, with no clear signals for movement up or down. This neutral position indicates a potential period of consolidation or uncertainty in the market.

Tripple Moving Agerage: The Tripple MOVING AVG is currently neutral, offering no clear guidance on market direction. This suggests that the market may be in a state of pause, with no strong trend emerging.

To accurately interpret a company's technical data, it is important to first examine its fundamentals. These include financial performance, management quality, and growth prospects. In addition, understanding the dynamics of the industry in which the company operates—such as competition, market trends, and regulatory factors—provides further insights. This combined analysis helps create a fuller picture, allowing for more precise conclusions to be drawn from the company's technical performance and stock behavior.
DISCLAIMER: We provide information and our musings based on events, but nothing on this site can be considered professional advice of any kind.
If you have enjoyed reading, spread the word:
Good prospects:
Companies with the best and the worst technicals.
Latest Regulatory Filings for SP5
Companies with the best and the worst fundamentals.

Debt, Deficits & Disaster: The Bond Market Crisis

Not Wall Street, But AI: The Real Force Democratizing Finance Across America

When Flooding Pays: A New Financial Bet
