
The Machines That Ate the Grid: Five Centuries of Power Hunger
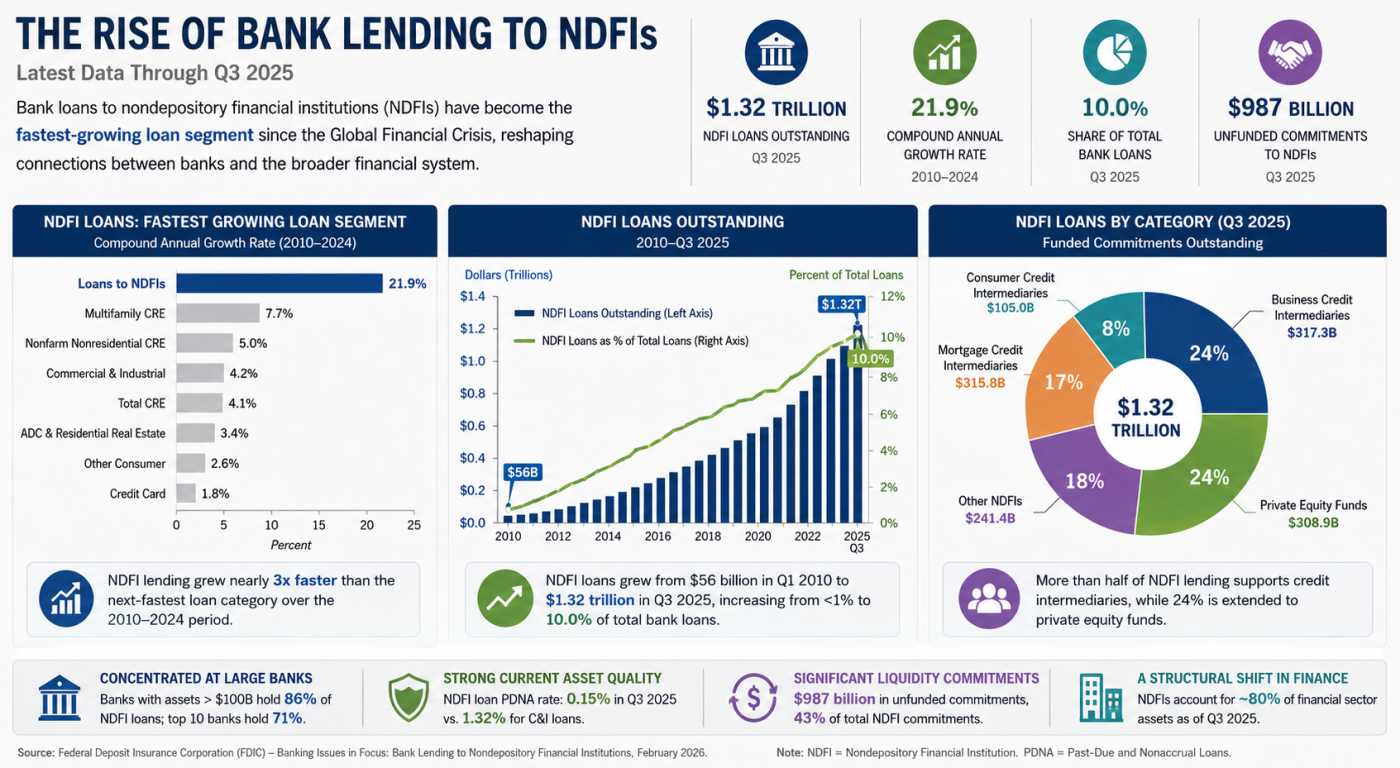
Private Credit’s Secret Banking Backbone Is Growing Faster Than Anyone Expected

America's $5 Trillion Business Handoff Has Already Begun

The Repair Economy Boom in Rural America
Technicals for APA Corporation


Price Summary
On 2026-05-08, APA's stock began at 36.21, peaked at 36.28, dipped to 35.17, and closed up -1.8% at 35.56, with a volume of 8428460 shares.In the last 52 weeks, the stock's top price was 44.39 and the bottom price was 16.71.
Technicals
Support and Resistance: The price is currently at 35.56, supported by 32.97 and resisted by 40.13. This indicates a range where 32.97 may provide a base for the price, while 40.13 serves as a cap on further upward movement for APA.
Aroon: AROON is pointing to a strong bearish trend, with Aroon Down increasing and the Aroon Oscillator staying low. This suggests that the downward trend is likely to continue, signaling ongoing bearish momentum. The persistent low level of the Aroon Oscillator indicates further weakness.

Bol. Bands: The BOLL BANDS is showing a neutral reading, with no clear direction indicated for upward or downward movement. This neutral position suggests a possible period of consolidation.

Parabolic SAR: The PSAR continues its bearish trend for APA Corporation, setting a resistance level that could hinder upward momentum. This resistance suggests that the market may face challenges in breaking higher, reflecting persistent bearish sentiment.

Stochastic: The STOCHASTIC is in a neutral stance for APA, not indicating a clear upward or downward trend. This suggests a period of market indecision, where neither bulls nor bears have the upper hand.

Tripple Moving Agerage: The current state of the Tripple MOVING AVG is neutral, with no clear trend direction indicated. This lack of directional bias suggests that the market may be in a phase of consolidation or uncertainty.

When evaluating a company, it is crucial to examine its fundamentals, including its financial statements, management structure, and market position. Additionally, understanding the broader industry trends, competition, and regulatory landscape helps to create a well-rounded view. By assessing both the company's internal factors and the external environment in which it operates, you can extract more valuable insights from its technical performance, such as stock price movements and trading patterns.
DISCLAIMER: We provide information and our musings based on events, but nothing on this site can be considered professional advice of any kind.
If you have enjoyed reading, spread the word:
Good prospects:
Companies with the best and the worst technicals.
Latest Regulatory Filings for SP5
Companies with the best and the worst fundamentals.

Debt, Deficits & Disaster: The Bond Market Crisis

Not Wall Street, But AI: The Real Force Democratizing Finance Across America

When Flooding Pays: A New Financial Bet
