More about Amazon.com, Inc.
Regulatory Filings for Amazon.com, Inc.
Fundamentals for Amazon.com, Inc.

America’s Empty Offices Hit Pensions Hard

Rural Hospitals Buckle Under Private Equity
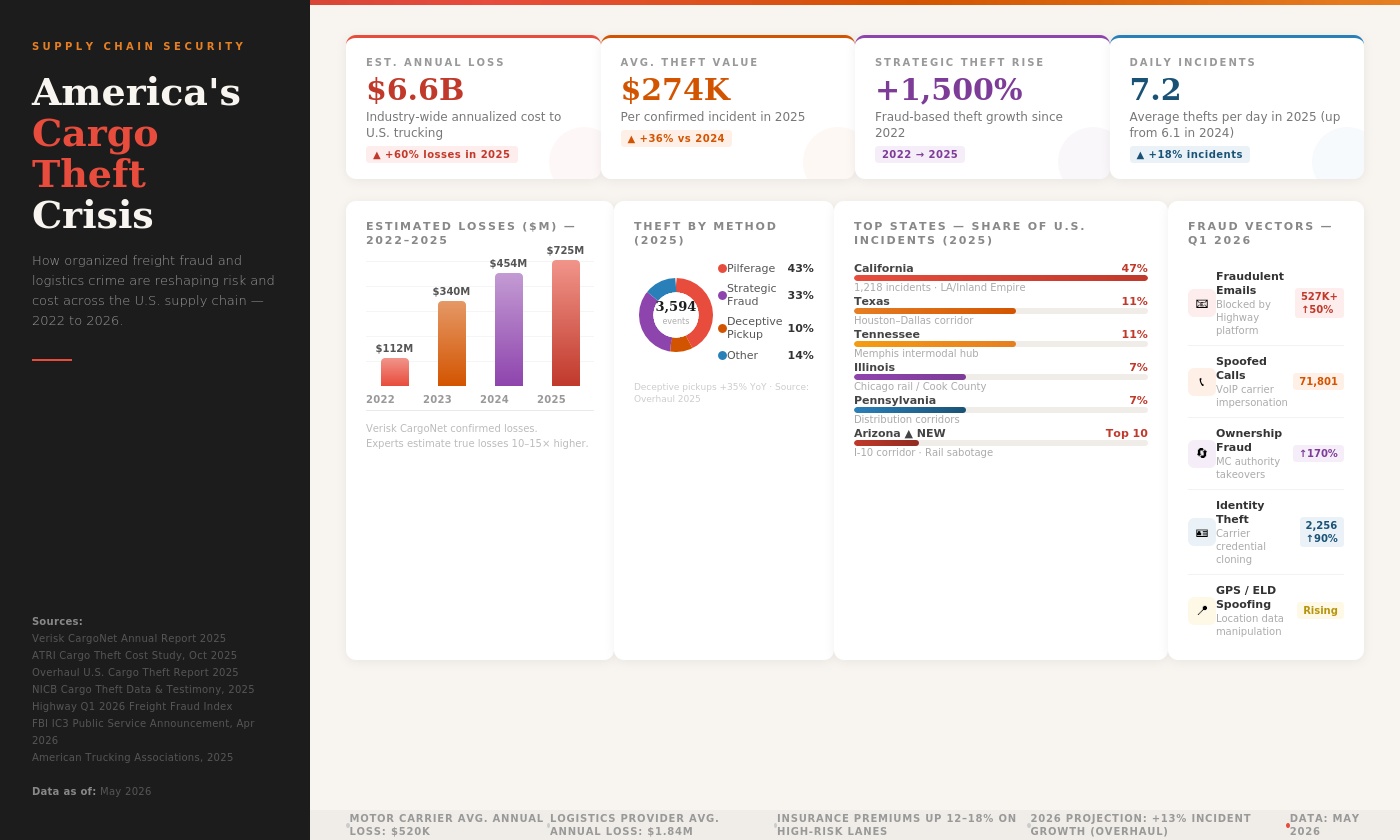
Fake Brokers, Spoofed GPS: Who Pays for Cargo Crime?

Crypto’s $2.4T Reality Check in 2026
Technicals for Amazon.com, Inc.


Price Summary
On 2026-05-19, Amazon.com, Inc.'s stock opened at 262.02, peaked at 262.21, hit a low of 255.19, and closed -1.02% lower at 259.34, with 40091649 shares changing hands.In the last 52 weeks, the stock's top price was 274.99 and the bottom price was 198.79.
Technicals
Support and Resistance: The current price is 259.34, with support at 246.47 and resistance at 263.99. This range suggests that the price might move between these levels, with 246.47 offering support and 263.99 capping further gains for Amazon.com, Inc..
Aroon: AROON is currently indicating a strong bearish trend, with Aroon Down rising and the Aroon Oscillator staying low. This suggests that the downward trend is likely to continue, signaling sustained bearish momentum. The steady low level of the Aroon Oscillator suggests that the market may face further declines.

Bol. Bands: The BOLL BANDS is in a neutral stance for AMZN, not indicating a clear upward or downward trend. This suggests a period of market indecision, where neither bulls nor bears have the upper hand.

Parabolic SAR: The PSAR for AMZN continues to signal a bearish stance, reinforcing a resistance level that could restrict upward movement. This resistance suggests that the market may remain under bearish pressure, with limited potential for breaking higher.

Stochastic: The STOCHASTIC is currently neutral, offering no clear guidance on market direction. This suggests that the market may be in a state of pause, with no strong trend emerging.

Tripple Moving Agerage: The alignment of the 20, 50, and 100 moving averages suggests a bearish trend, but the wavering slopes of the 20 and 50 SMAs hint at a potential shift. This weakening of momentum could indicate that the bearish trend is running out of steam, possibly leading to a bullish reversal in the near future. Investors should be aware of the possibility of a market turnaround as the current downtrend weakens for Amazon.com, Inc..

Before focusing on a company's technical data, such as stock price movements, it's essential to analyze its fundamentals. These include factors like profitability, cash flow, and debt management. Additionally, considering the broader industry landscape—including market trends, competition, and regulatory changes—offers deeper insights. This comprehensive approach allows for a more meaningful interpretation of the company's technical indicators, providing a clearer picture of its financial health and future prospects.
If you have enjoyed reading, spread the word:
Good prospects:
Companies with the best and the worst technicals.
Latest Regulatory Filings for SP5
Companies with the best and the worst fundamentals.

The Machines That Ate the Grid: Five Centuries of Power Hunger
Private Credit’s Secret Banking Backbone Is Growing Faster Than Anyone Expected

America's $5 Trillion Business Handoff Has Already Begun
