More about Ameriprise Financial, Inc.
Regulatory Filings for Ameriprise Financial, Inc.
Fundamentals for Ameriprise Financial, Inc.
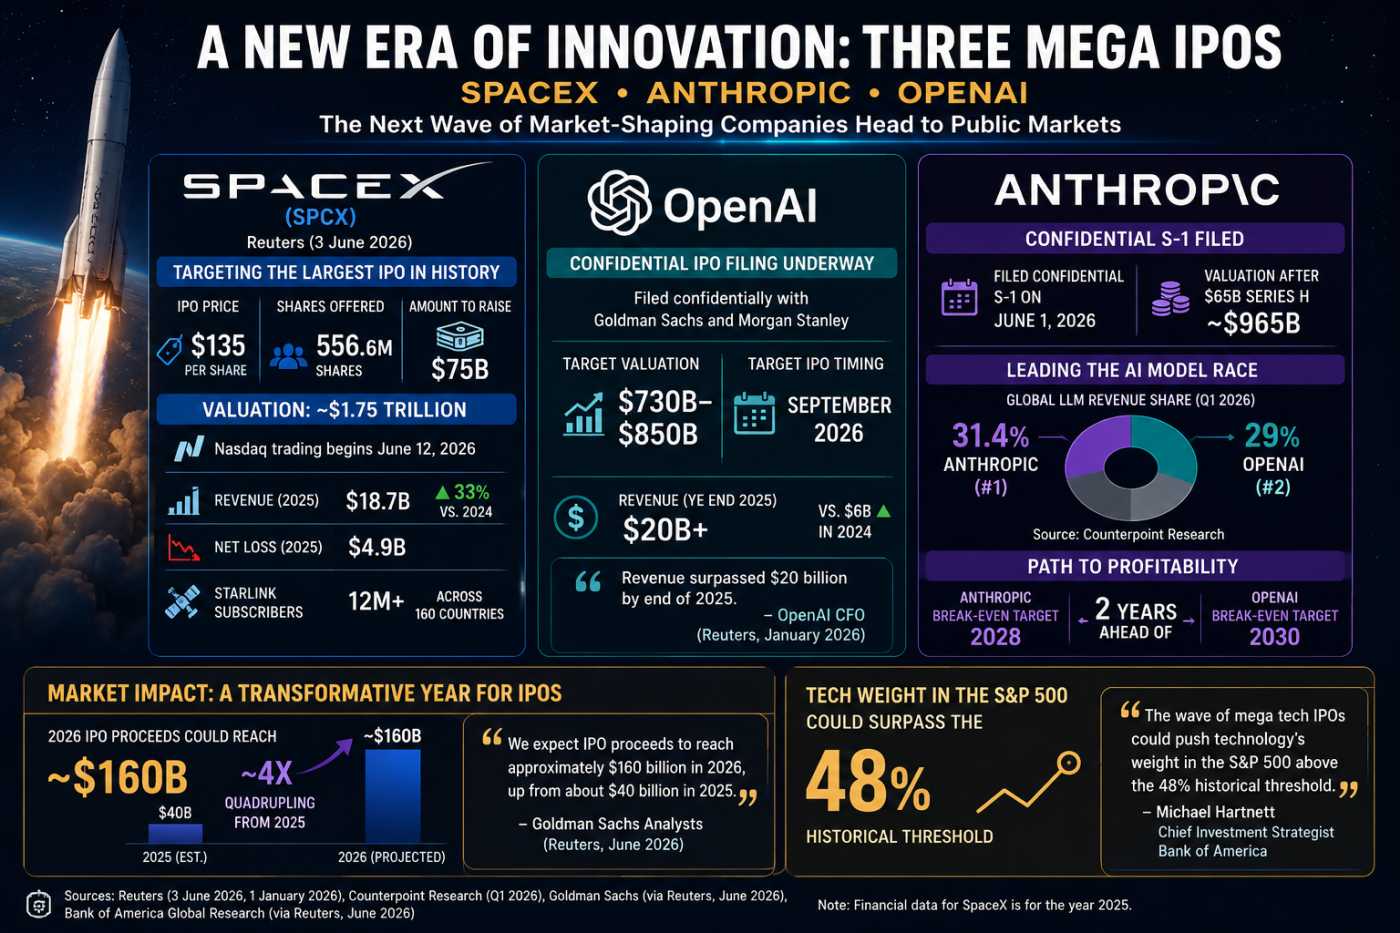
The Biggest IPO Year Ever: Can Markets Absorb It?
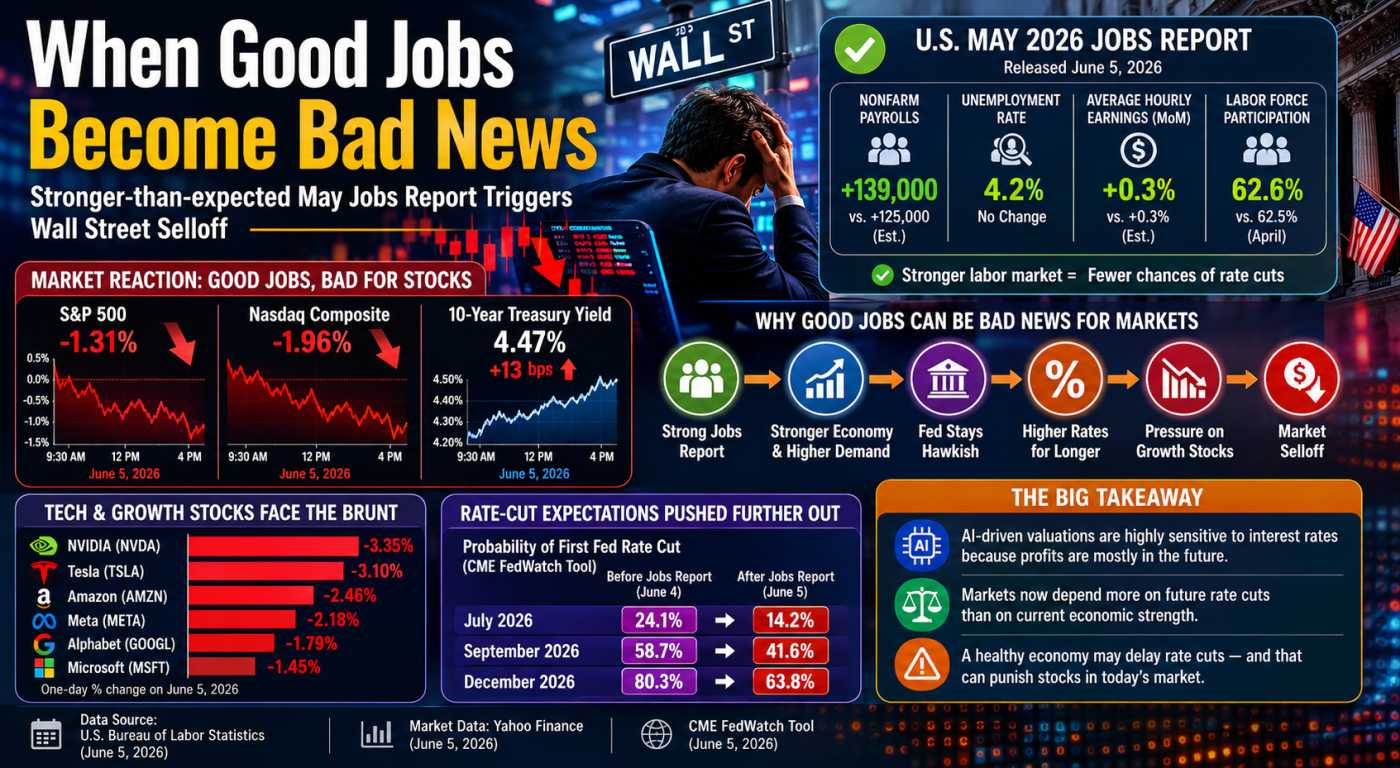
The Jobs Report That Crashed the Rally

The Fed Study Revealing Tomorrow's Investment Themes
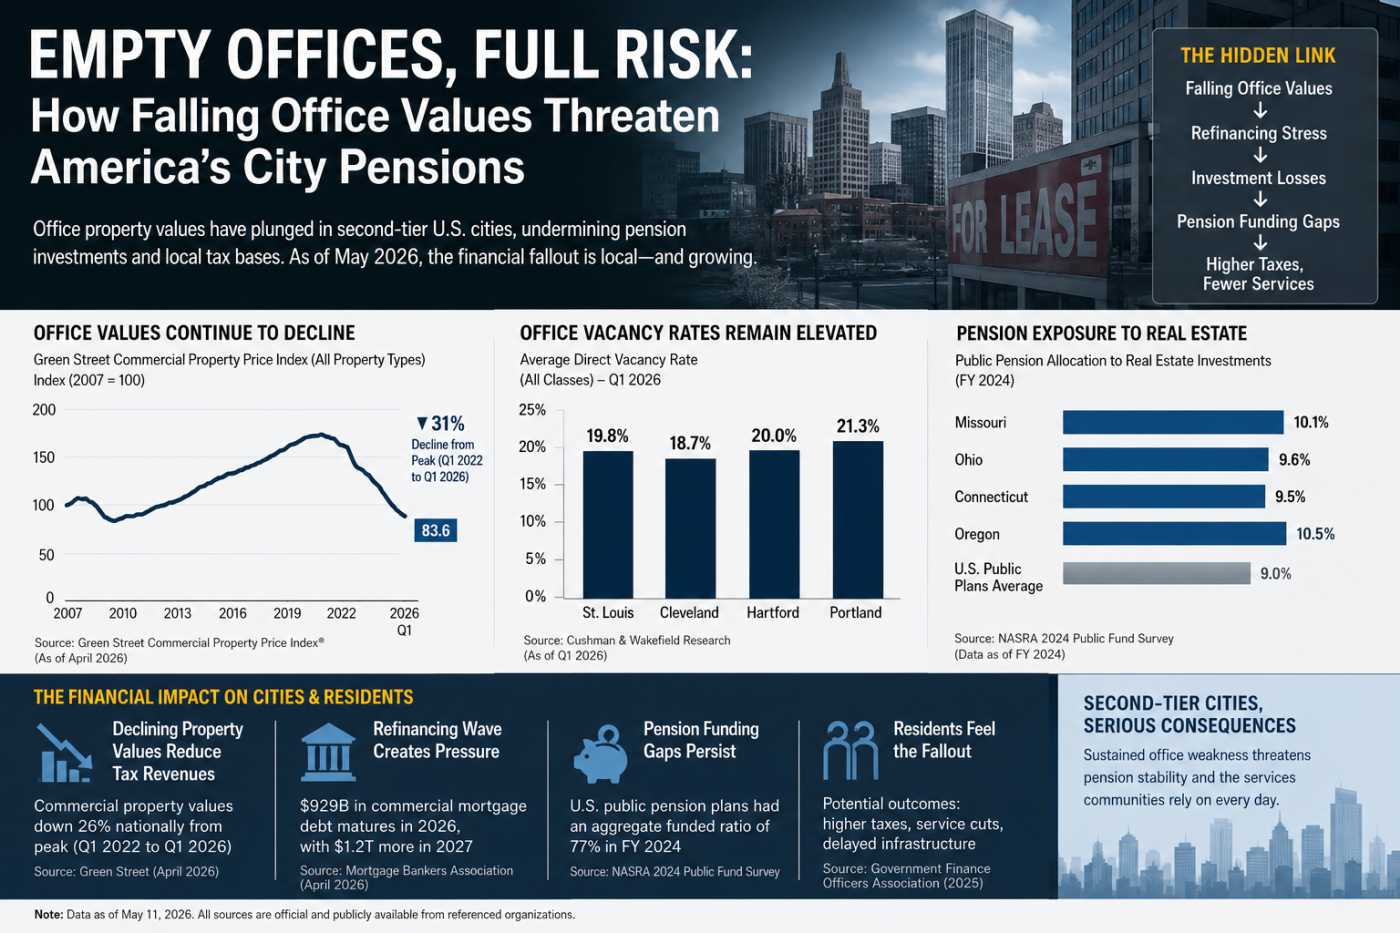
America’s Empty Offices Hit Pensions Hard
Technicals for Ameriprise Financial, Inc.


Price Summary
On 2026-06-10, AMP's stock started at 448.1, reached a high of 454.15, fell to 445.65, and ended 0.56% up at 450.62, with 394990 shares traded.Throughout the 52-week period, the stock hit a high of 545.5 and a low of 430.4.
Technicals
Support and Resistance: The price for AMP is 450.62, with support at 437.94 and resistance at 453.78. This suggests a range where 437.94 acts as a base, preventing declines, and 453.78 caps gains, defining key trading levels.
Aroon: The AROON is currently neutral, offering no clear guidance on market direction. This suggests that the market may be in a state of pause, with no strong trend emerging.

Bol. Bands: The BOLL BANDS is in a neutral stance, with no clear direction indicated for the market. This lack of clarity suggests that the market may be in a state of equilibrium for AMP, with no strong trend emerging.

Parabolic SAR: The PSAR continues to indicate a bullish outlook, setting a crucial support level. This strong support could bolster the ongoing upward trend, suggesting that the market may remain in a positive trajectory. Investors may view this as a sign of sustained bullish momentum.

Stochastic: The STOCHASTIC is in a neutral stance, with no clear signals for movement up or down. This neutral position indicates a potential period of consolidation or uncertainty in the market.

Tripple Moving Agerage: The Tripple MOVING AVG is currently neutral, showing no clear bias toward a rising or falling trend. This lack of directional clarity suggests that the market may be in a holding pattern, awaiting further developments.

To derive valuable insights from a company's technical performance, it is essential to first understand its fundamentals. This includes its financial health, business model, and market share. Equally important is the industry context, such as competition, consumer demand, and market trends. By examining these aspects together, investors can gain a more comprehensive view of how the company's stock behaves and whether it's aligned with its underlying value.
If you have enjoyed reading, spread the word:
Good prospects:
Companies with the best and the worst technicals.
Latest Regulatory Filings for SP5
Companies with the best and the worst fundamentals.

Rural Hospitals Buckle Under Private Equity
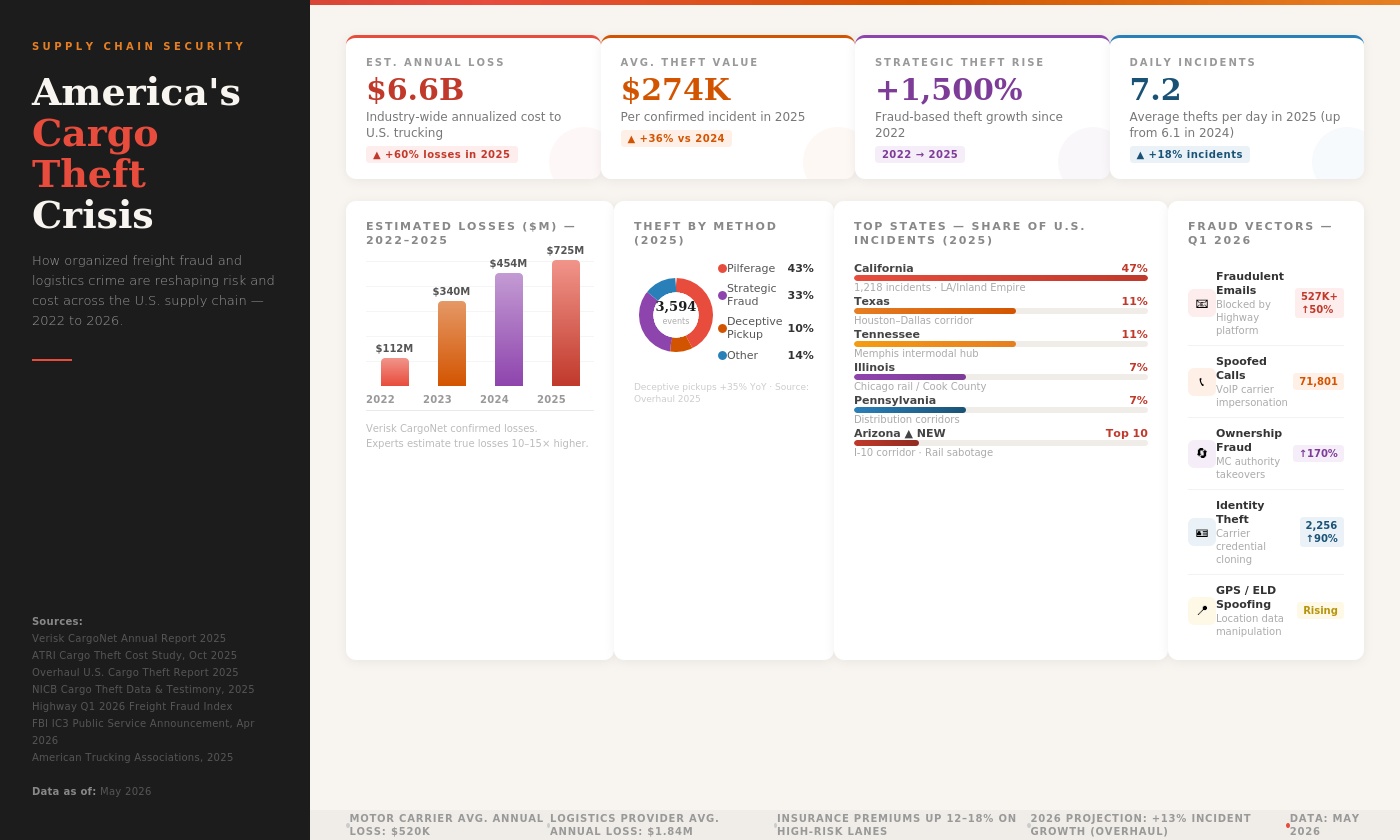
Fake Brokers, Spoofed GPS: Who Pays for Cargo Crime?
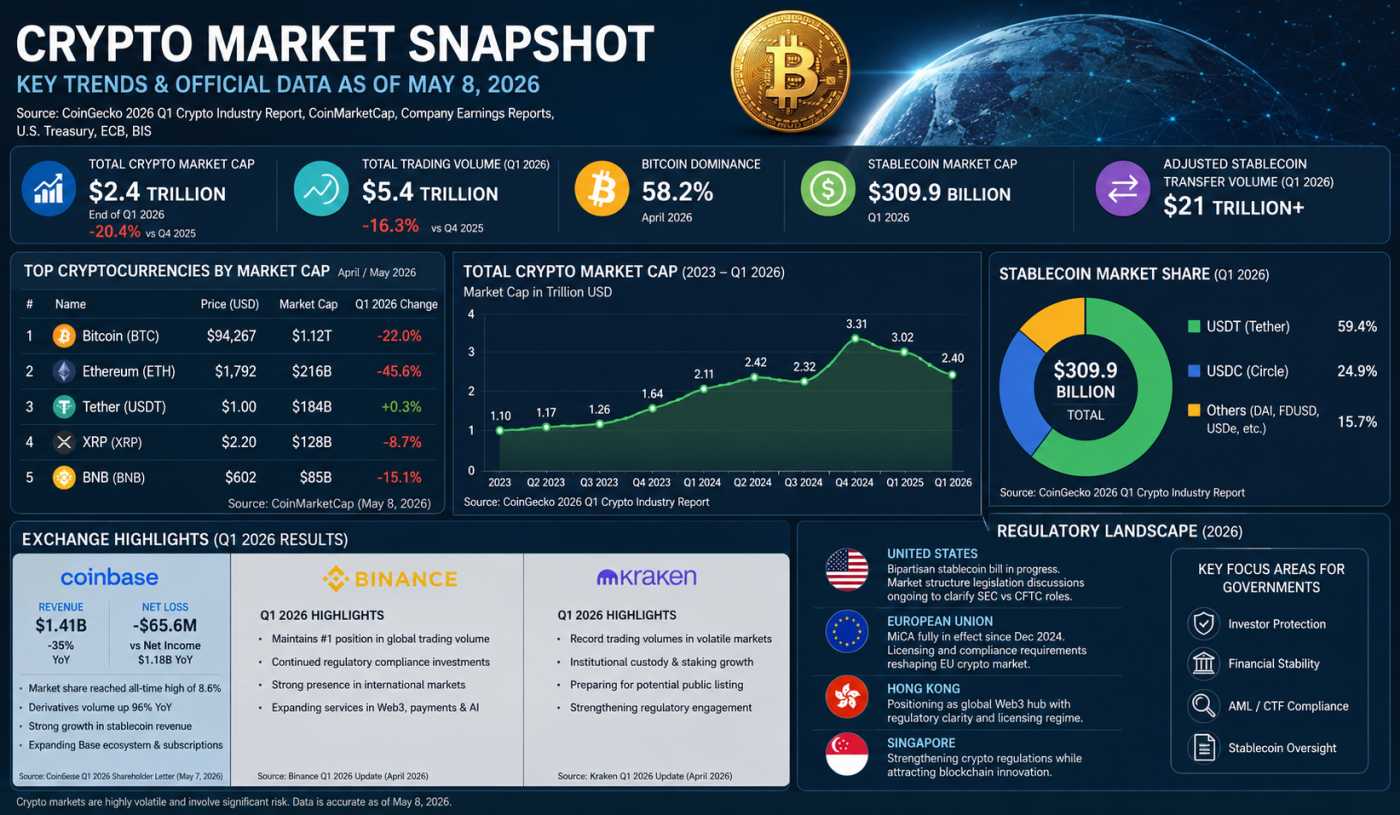
Crypto’s $2.4T Reality Check in 2026
