
America’s Empty Offices Hit Pensions Hard

Rural Hospitals Buckle Under Private Equity
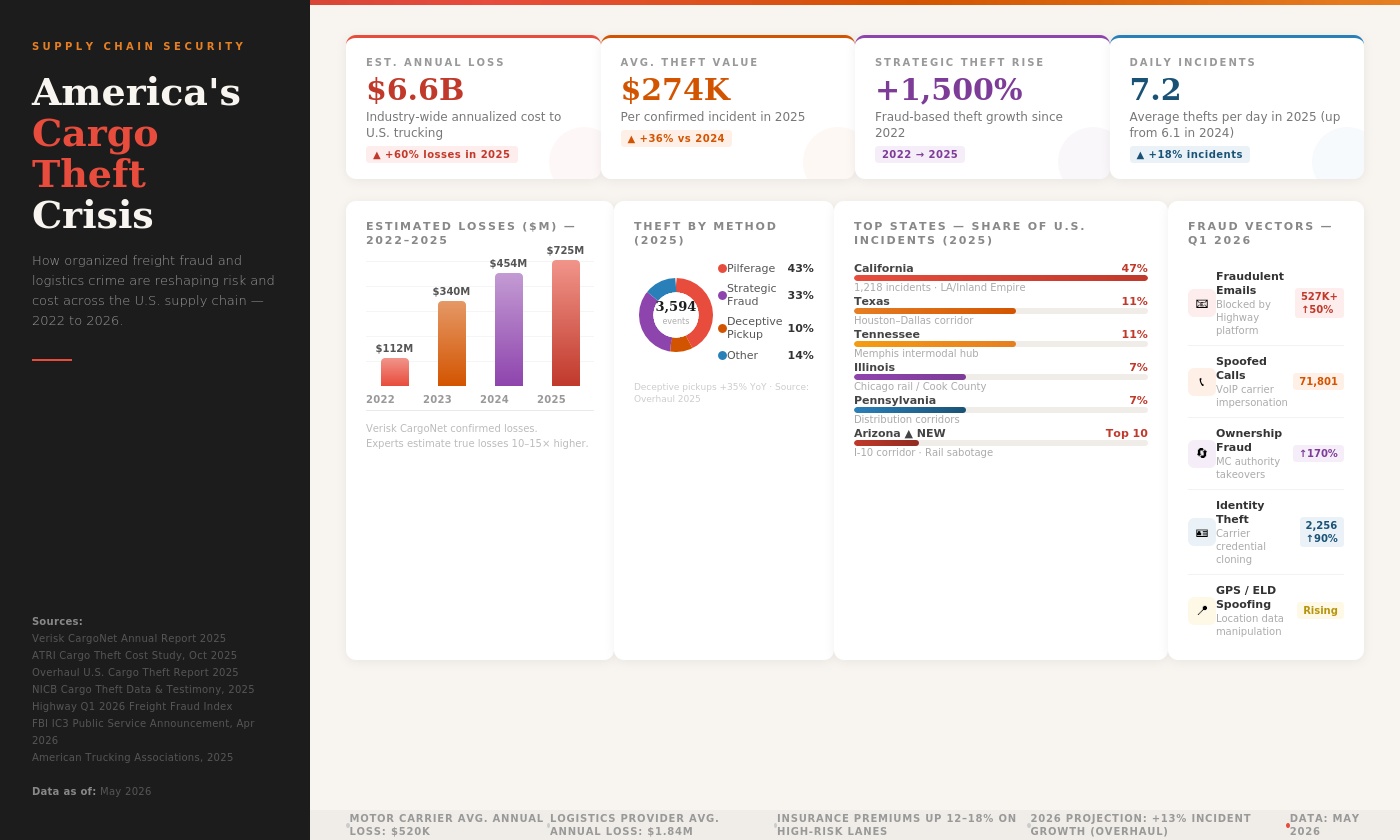
Fake Brokers, Spoofed GPS: Who Pays for Cargo Crime?
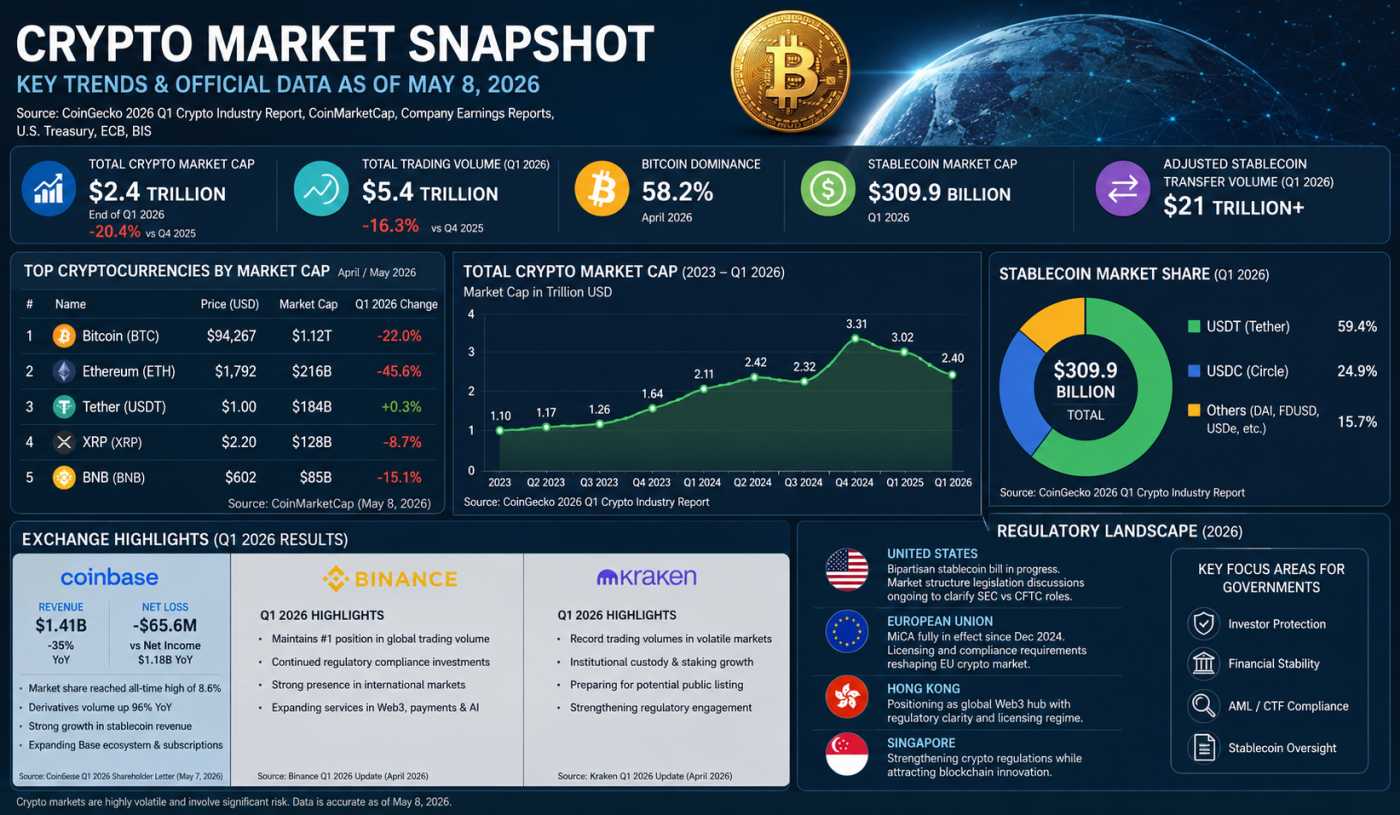
Crypto’s $2.4T Reality Check in 2026
Technicals for Autodesk, Inc.


Price Summary
Autodesk, Inc.'s stock started the year at 249.03, climbed to a high of 251.16, fell to 243.01, and closed -1.96% down at 244.16, with 1979948 shares traded on 2026-05-19.The stock reached its highest price of 326.79 and its lowest price of 218.45 during the 52-week period.
Technicals
Support and Resistance: The current price is 244.16, with support at 243.58 and resistance at 251.17. This range suggests that the price might move between these levels, with 243.58 offering support and 251.17 capping further gains for Autodesk, Inc..
Aroon: The AROON is in a neutral stance for ADSK, not indicating a clear upward or downward trend. This suggests a period of market indecision, where neither bulls nor bears have the upper hand.

Bol. Bands: The current reading of the BOLL BANDS indicator suggests a neutral stance, with no clear signals indicating an upward or downward direction. This lack of directional bias suggests the market may be in a period of consolidation or uncertainty.

Parabolic SAR: The PSAR has moved from a bearish to a bullish direction, signaling a potential trend reversal. If this change aligns with other indicators, it could suggest a strong bullish signal. Traders should consider this shift as a possible opportunity, particularly if other market signals support the new direction.

Stochastic: The current reading of the STOCHASTIC is neutral, offering no clear signals for a movement in either direction. This suggests that the market may be in a holding pattern, with no dominant trend in place.

Tripple Moving Agerage: The moving averages for the 20-50-100 periods point to a bullish trend for ADSK, though the slopes of the faster averages suggest that this strength may be waning. The potential for a reversal is becoming evident, as the shorter-term averages indicate that the current upward momentum could be losing steam.

A comprehensive approach to analyzing a company requires considering both its technical and fundamental aspects. The company's fundamentals, such as its earnings, growth prospects, and financial health, provide a strong foundation for understanding technical indicators. Additionally, examining the industry it operates in helps contextualize the company's position within the broader market. By integrating these factors, one can gain more valuable insights into the company's stock performance and potential investment opportunities.
If you have enjoyed reading, spread the word:
Good prospects:
Companies with the best and the worst technicals.
Latest Regulatory Filings for SP5
Companies with the best and the worst fundamentals.

The Machines That Ate the Grid: Five Centuries of Power Hunger
Private Credit’s Secret Banking Backbone Is Growing Faster Than Anyone Expected

America's $5 Trillion Business Handoff Has Already Begun
